Purpose
This is the independent analysis of the 2.4 Tesla BBMPulser 5B paired with the 7″ Strip Coil 1.0mm. The numbers come from direct measurements taken on calibrated lab instruments. What follows is what the pairing actually produces in a controlled environment, not what the data sheet claims.
Gauss Labs certifies the 2.4 Tesla BBMPulser 5B. Its measured performance meets the Gauss Labs standard, verified directly from the system with laboratory-grade instruments. The number on the badge can be checked at any time in the public certification registry.
Gauss Labs certifies the 7″ Strip Coil 1.0mm. Its measured performance meets the Gauss Labs standard, verified directly from the system with laboratory-grade instruments. The number on the badge can be checked at any time in the public certification registry.
This device/accessory was purchased by Gauss Labs for internal testing and use.
Executive Summary
The 2.4 Tesla BBMPulser 5B paired with the 7″ Strip Coil 1.0mm accessory was tested at each of its 9 settings. The three cards below show the most important metrics: peak field strength, effective field diameter, and operating frequency. Secondary metrics and detail for each device setting follow in the rest of the report.
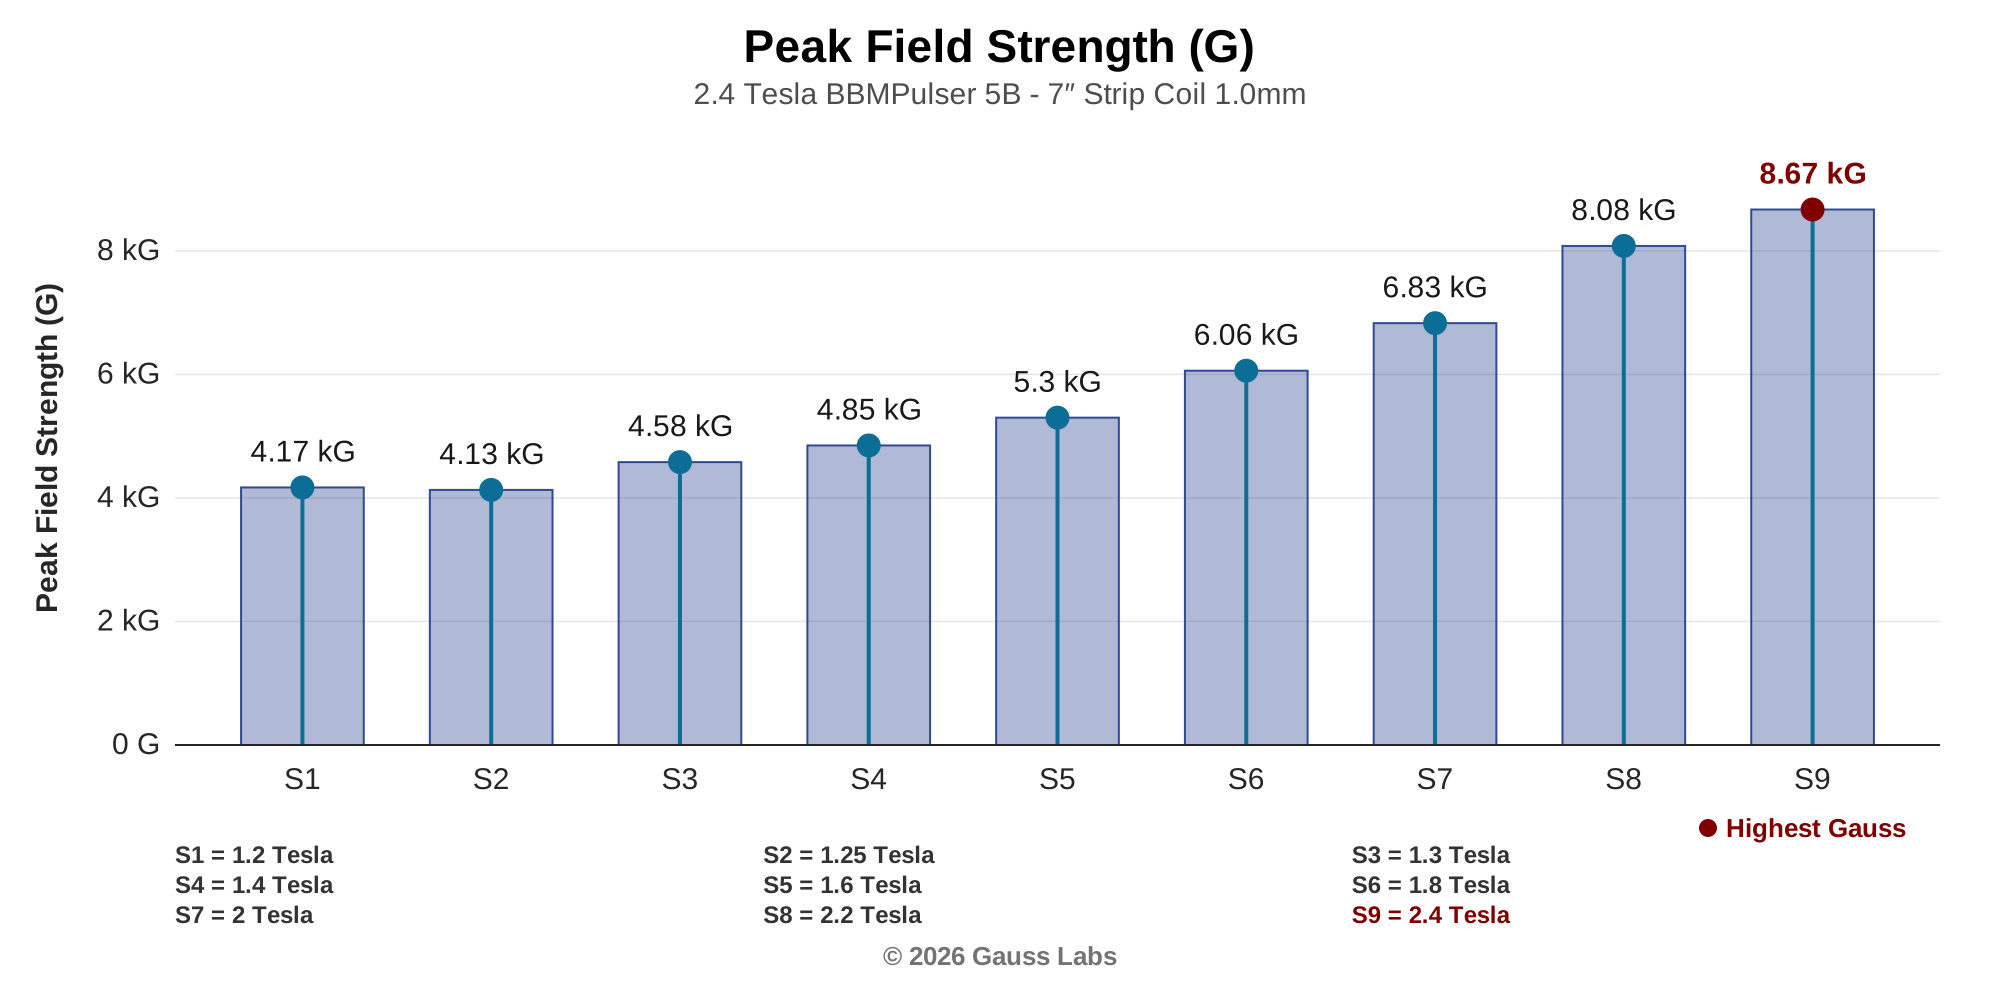
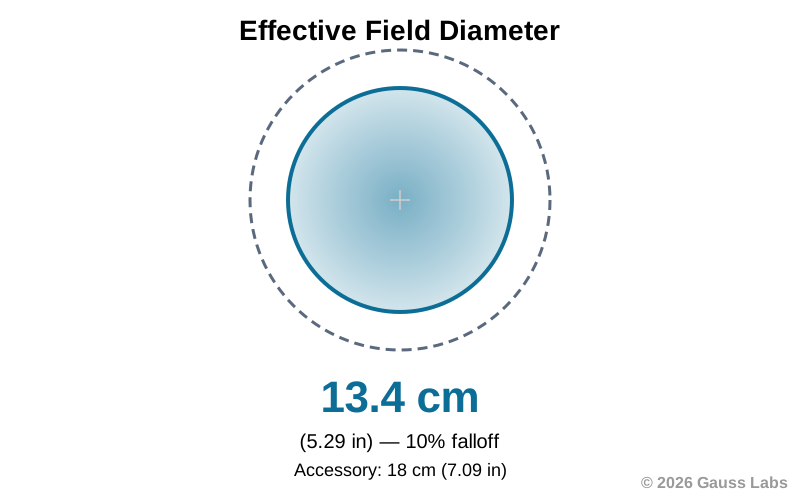
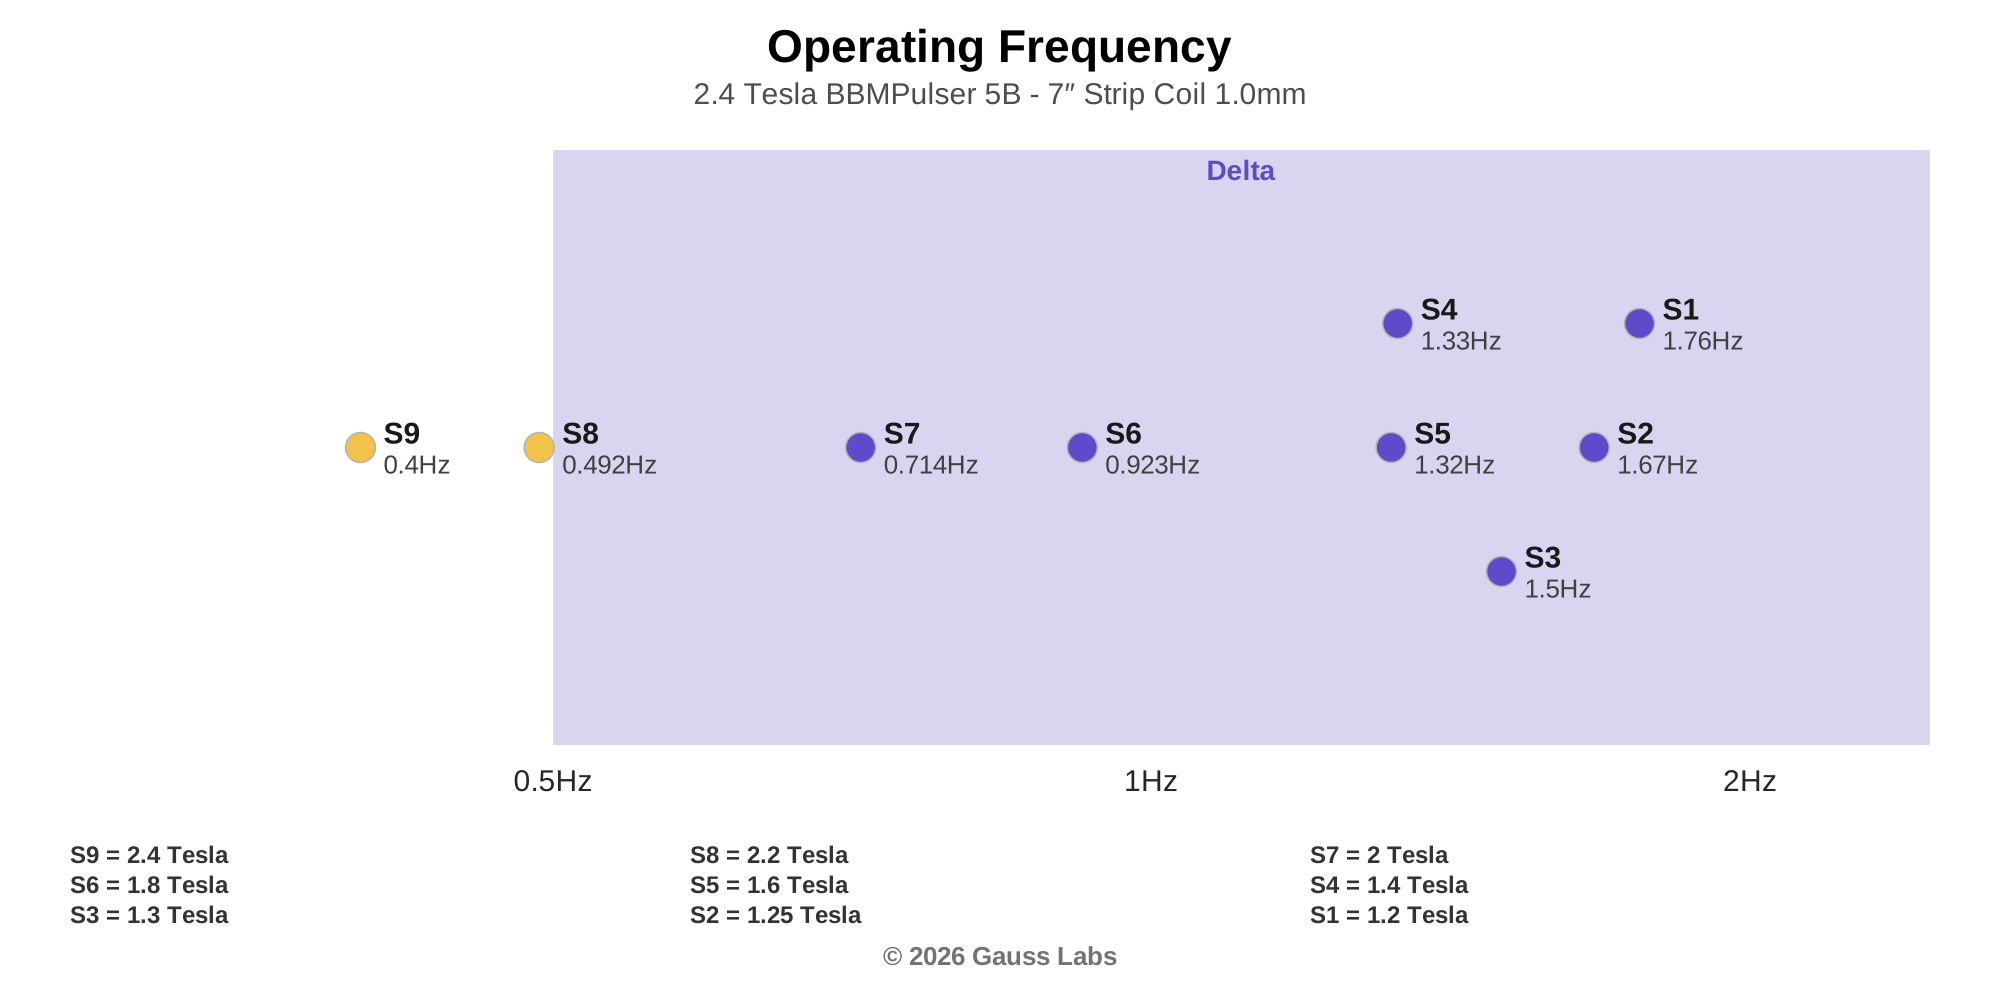
The 2.4 Tesla BBMPulser 5B paired with the 7″ Strip Coil 1.0mm was tested across multiple settings, using calibrated lab instruments instead of manufacturer-provided figures. The pairing matters: the same accessory on different devices, or different accessories on the same device, can produce measurably different results.
- Peak field strength ranges from 4.13 kG at the lowest setting to 8.67 kG at the highest. Gauss Labs groups this device in the higher-intensity range, which the lab sets at peaks above about 1,000 Gauss. Stronger peaks carry the field farther from the surface, giving clinicians reach and intensity options to match different session goals.
- Operating frequency spans 0.4 Hz to 1.8 Hz. A wide frequency range gives clinicians and users more settings to choose from on a single device.
Certification
The 2.4 Tesla BBMPulser 5B paired with 7″ Strip Coil 1.0mm is certified by Gauss Labs. The certification confirms that the measured performance meets the Gauss Labs standard, verified directly from the system with laboratory-grade instruments. One criterion carries a Conditional Pass; the note beneath the checklist explains the alternate reading behind it.
The standard test measured 1.76 Hz for setting 1 frequency against the documented 1.19 Hz, a gap of 47.9%, outside the 30% tolerance. While the frequency at the Setting 1 mark measured 1.76Hz. As the device is turned up, the frequency decreases and can be set to 1.19Hz. The alternate frequency reading of 1.19 Hz brings the gap to 29.0%, within the 30% tolerance.
This criterion passes on the alternate reading. The standard test result is retained in this report alongside it.
Each certified device and accessory carries its own number on the certificate. A certification can be verified at any time through the Gauss Labs certification registry. These certifications can be viewed and shared at https://gausslabs.tech/client-certifications/bob-becker-magnetic-pulser/.
Field Coverage & Timing
The three cards below characterize the field shape and reach for the pairing as a whole. Together they describe how much total energy the accessory delivers, how concentrated the field is, and how evenly the field distributes across the scan axes.
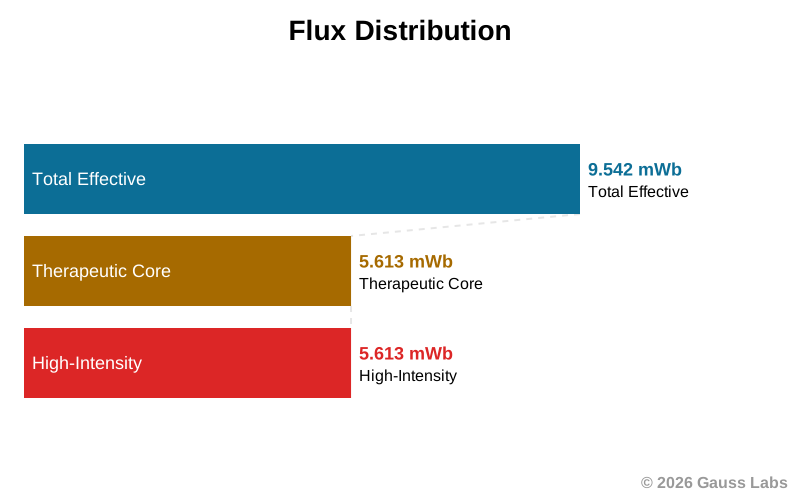
Together these three metrics describe the field the accessory produces at its surface. Each one measures a different property of that field: total energy, focus, and evenness across the scan axes.
- Total effective flux, the total magnetic energy delivered to the body per pulse, measures 9.542 mWb at the strongest setting. Higher flux means stronger field, larger area, or both.
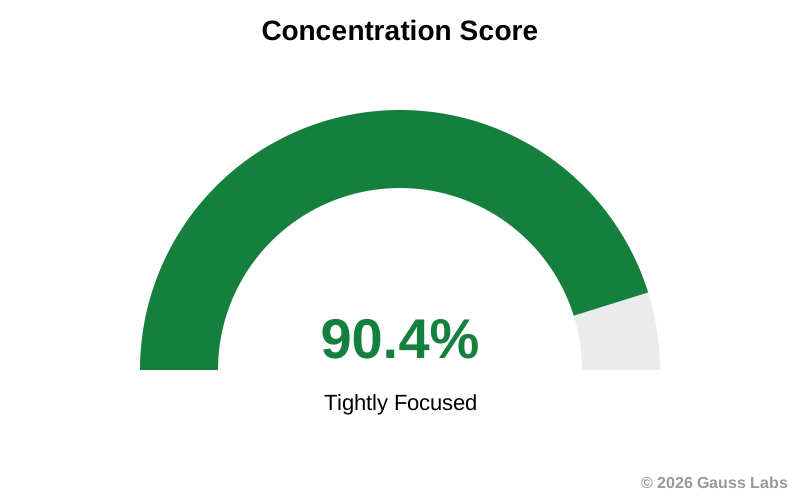
- Concentration score measures 90.4%. Higher concentration delivers more energy to the target area; lower values give broader, gentler coverage.
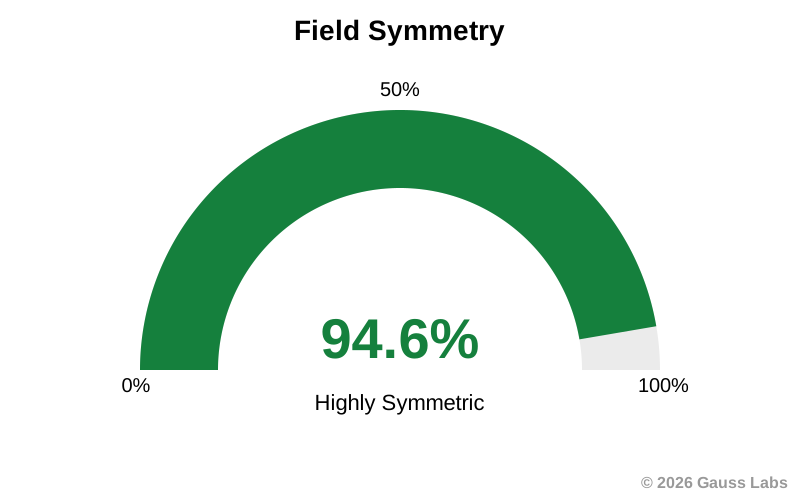
- Field symmetry measures 94.6%. Higher symmetry means the field strength on the four measured radial axes is nearly identical at every distance from center.
Field Strength Comparison overlays each setting's field strength as it falls off from the center of the accessory. Rise/Fall Time shows how long each pulse takes to turn on and how long it takes to turn off.
Field Strength Comparison
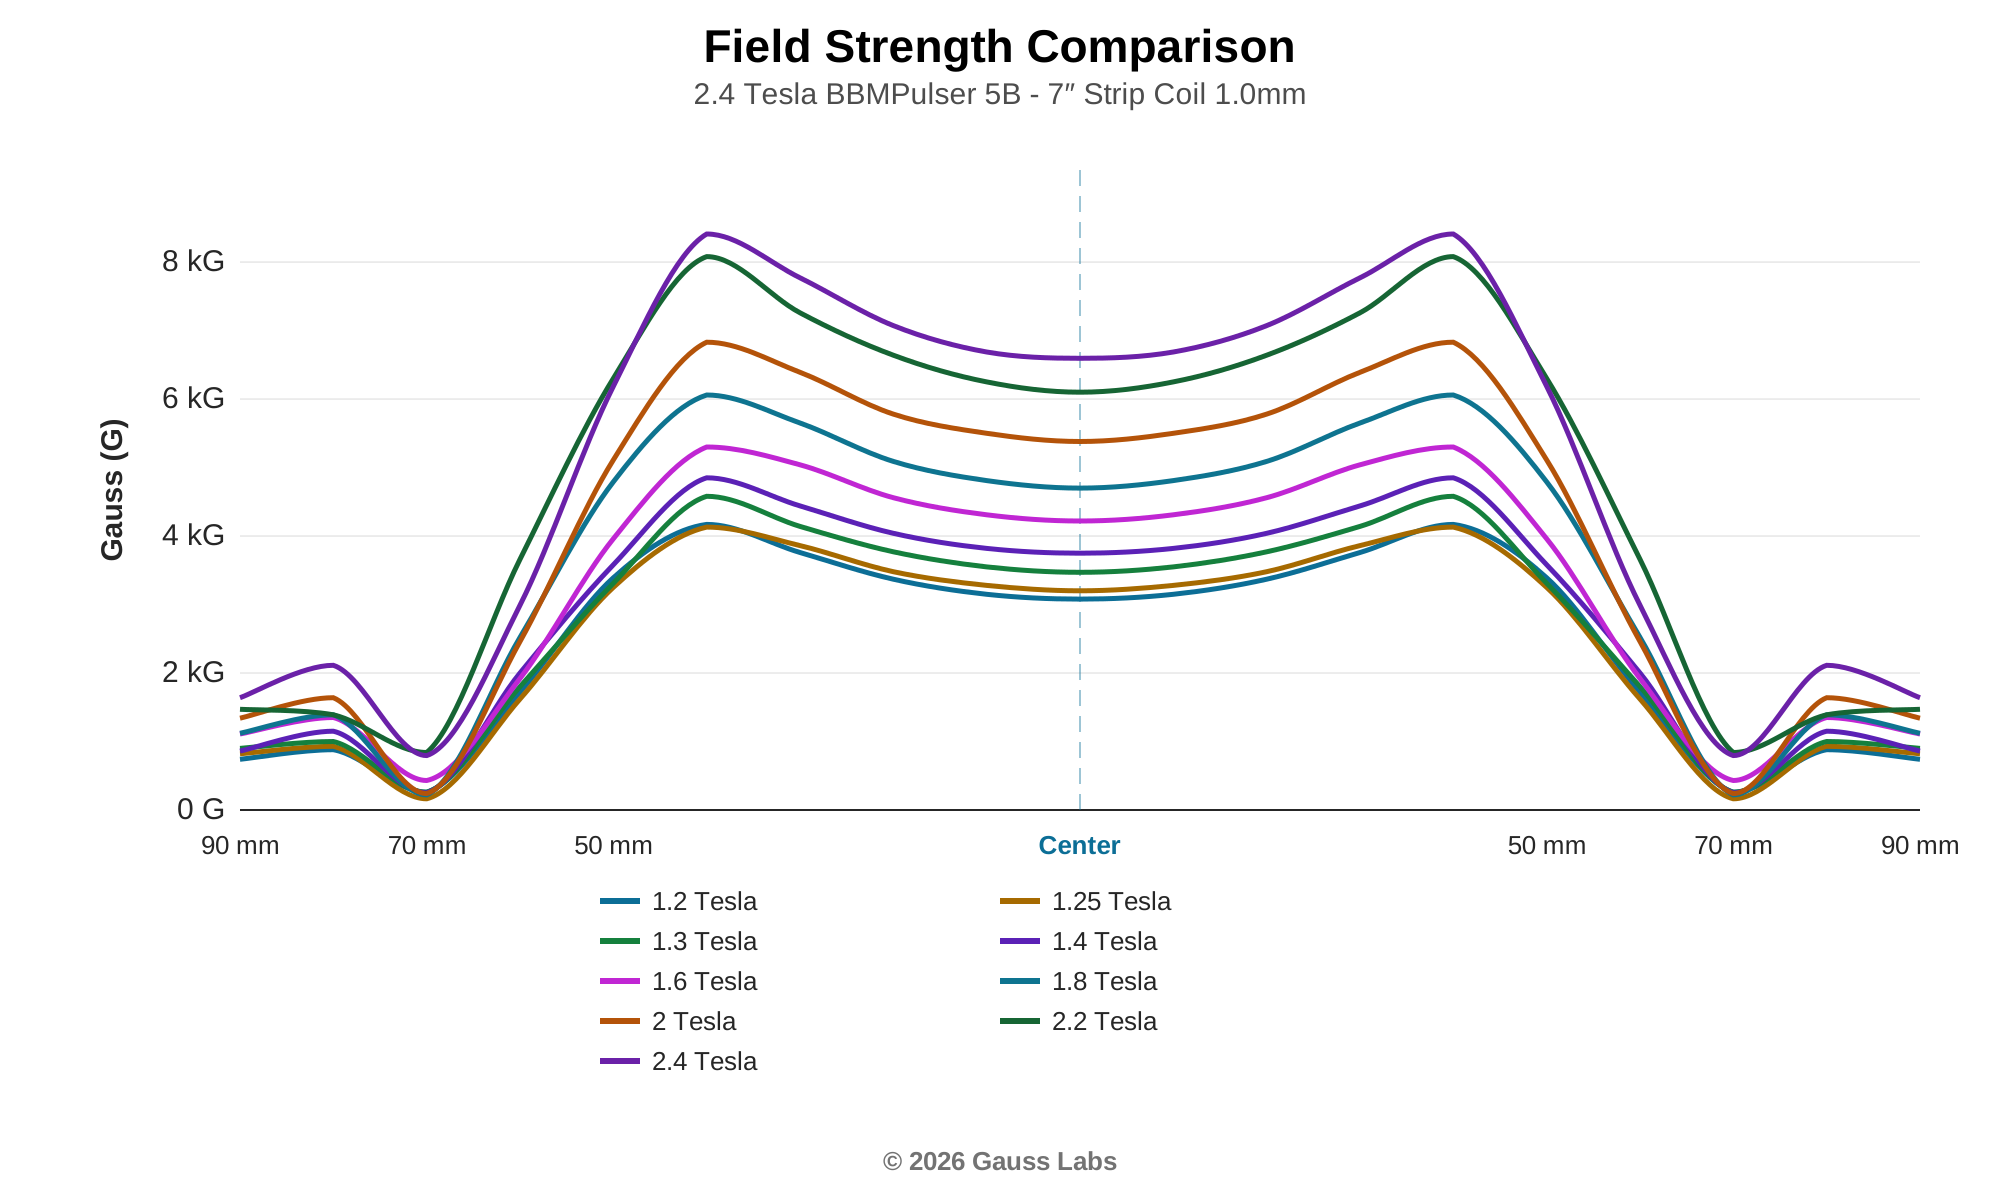
The Field Strength Comparison shows each setting's field strength from the center, horizontally measured moving outward. The chart's peaks represent the measurements taken from the points with the highest gauss readings.
Together these two views show the device's field strength and pulse timing for each setting tested.
- Field Strength Comparison overlays each setting's field profile along the surface. Peaks range from 4.13 kG to 8.67 kG. The overlay shows the Gauss output measured horizontally outward along the accessory.
Per-Setting Metrics
This section looks at each device setting on its own. Every setting gets its own charts and a table of measured values, the detail behind the summary metrics earlier in the report.
Setting 1 - 1.2 Tesla
Field Cross-Section (surface)
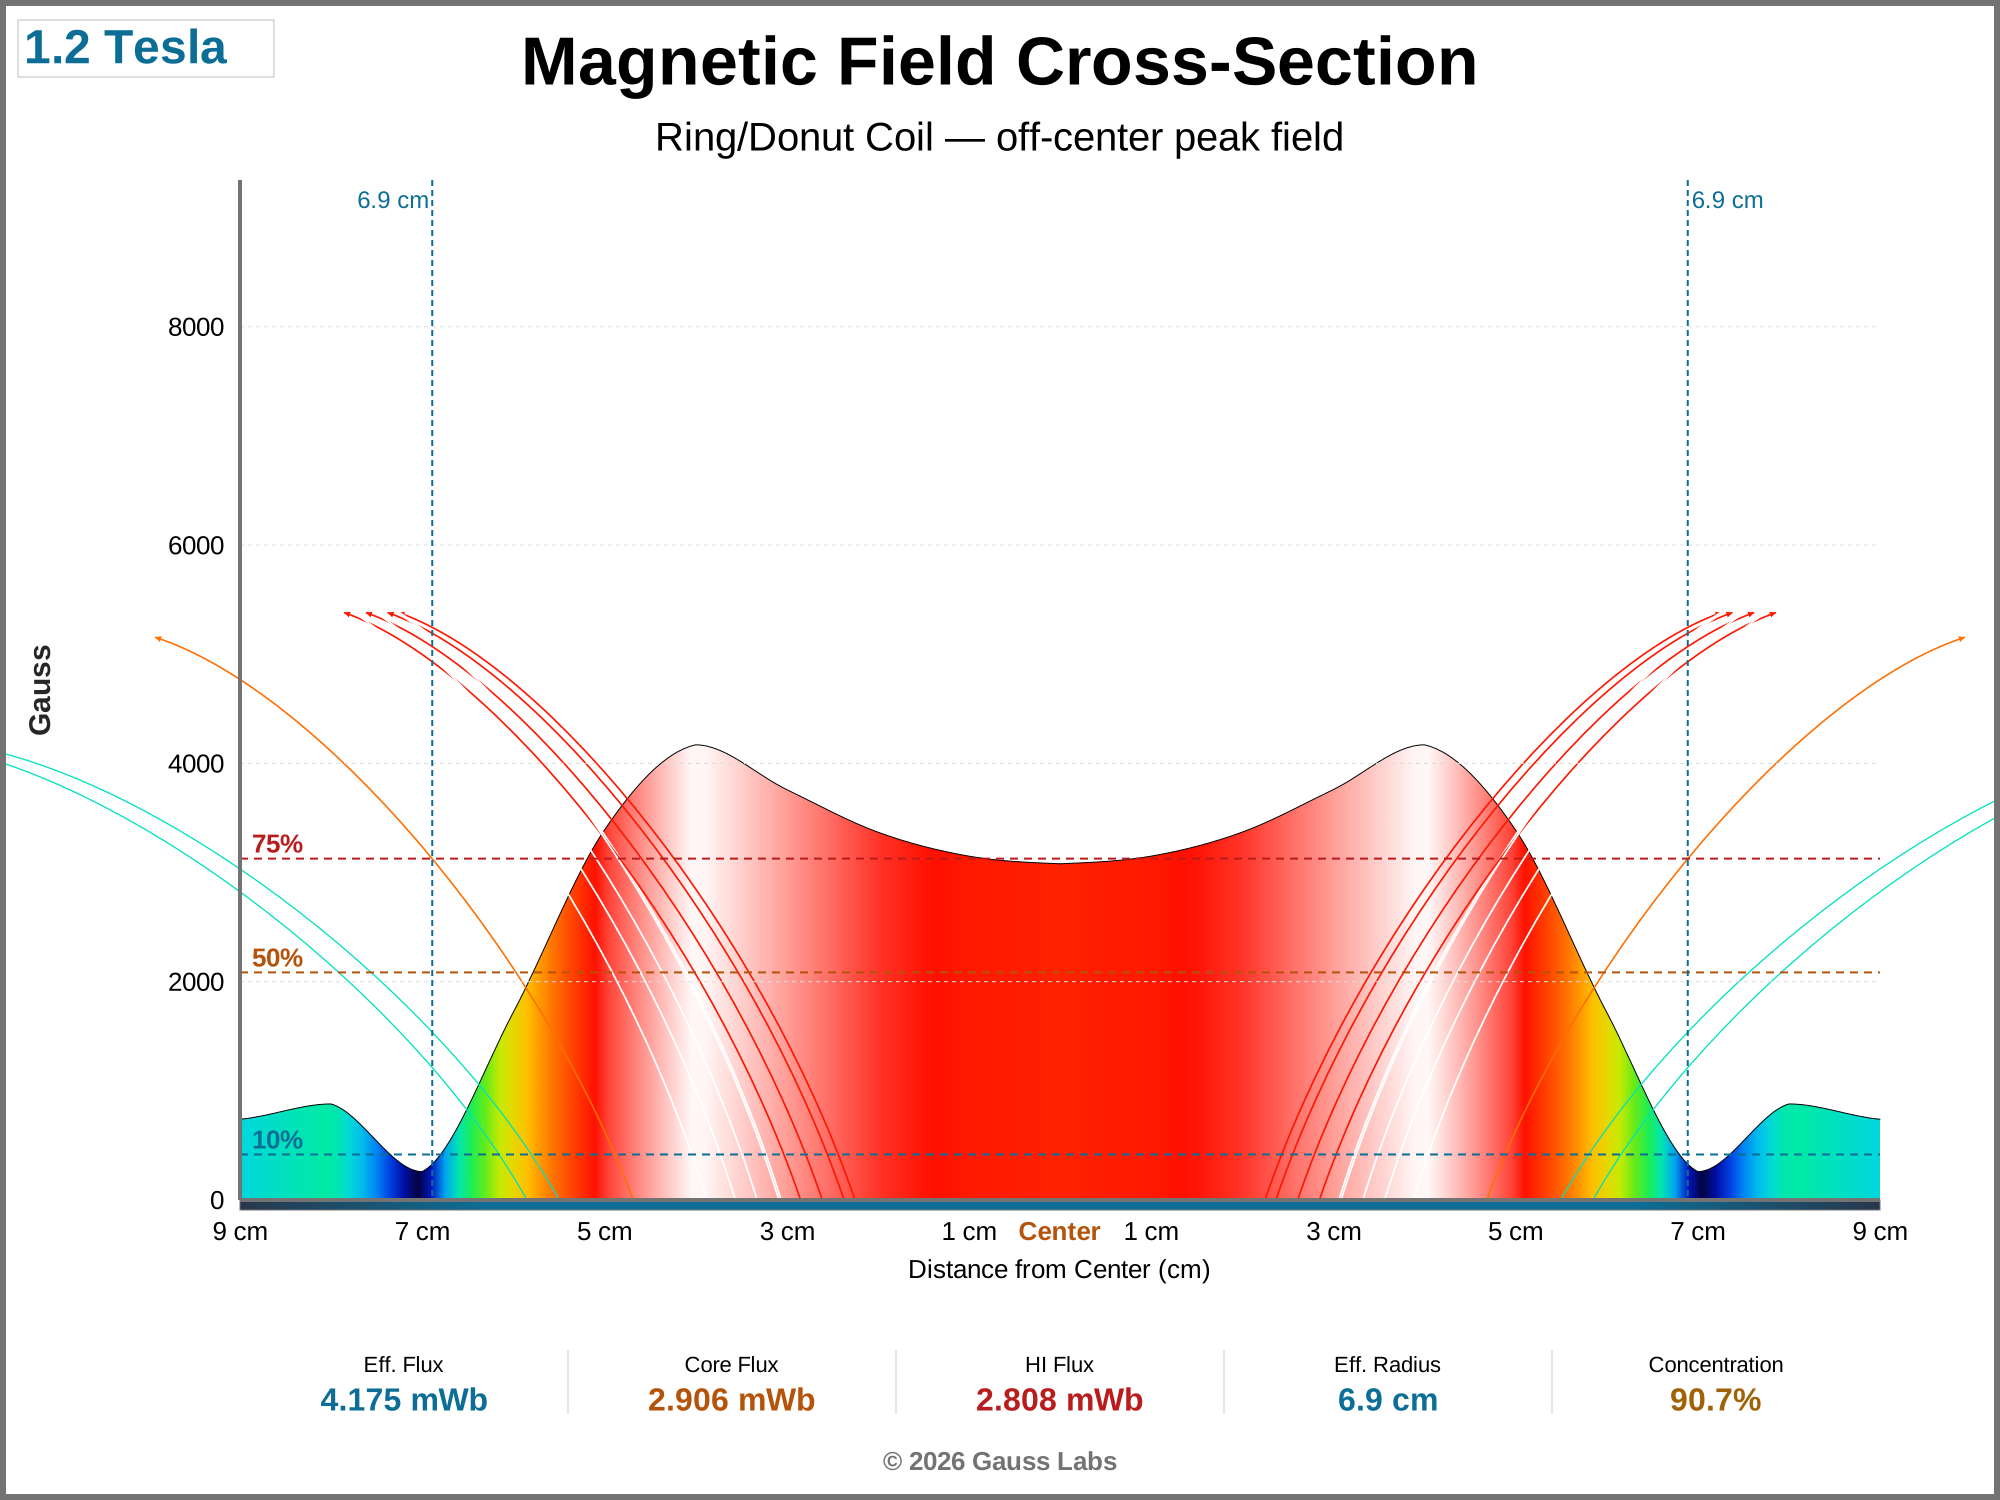
Side view of the field rising out of the accessory surface. Warm colors mark the strongest field; cool colors mark where it falls off toward the edges. The dashed lines flag where the field has dropped to 75%, 50%, and 10% of peak. The curved arrows are flux lines (see Flux Line in the glossary). The Gauss scale is shared across all settings, so a weaker setting's mound sits visibly lower than the strongest.
| Frequency | 1.76 Hz |
| Peak Field Strength | 4.17 kG |
Setting 2 - 1.25 Tesla
Field Cross-Section (surface)
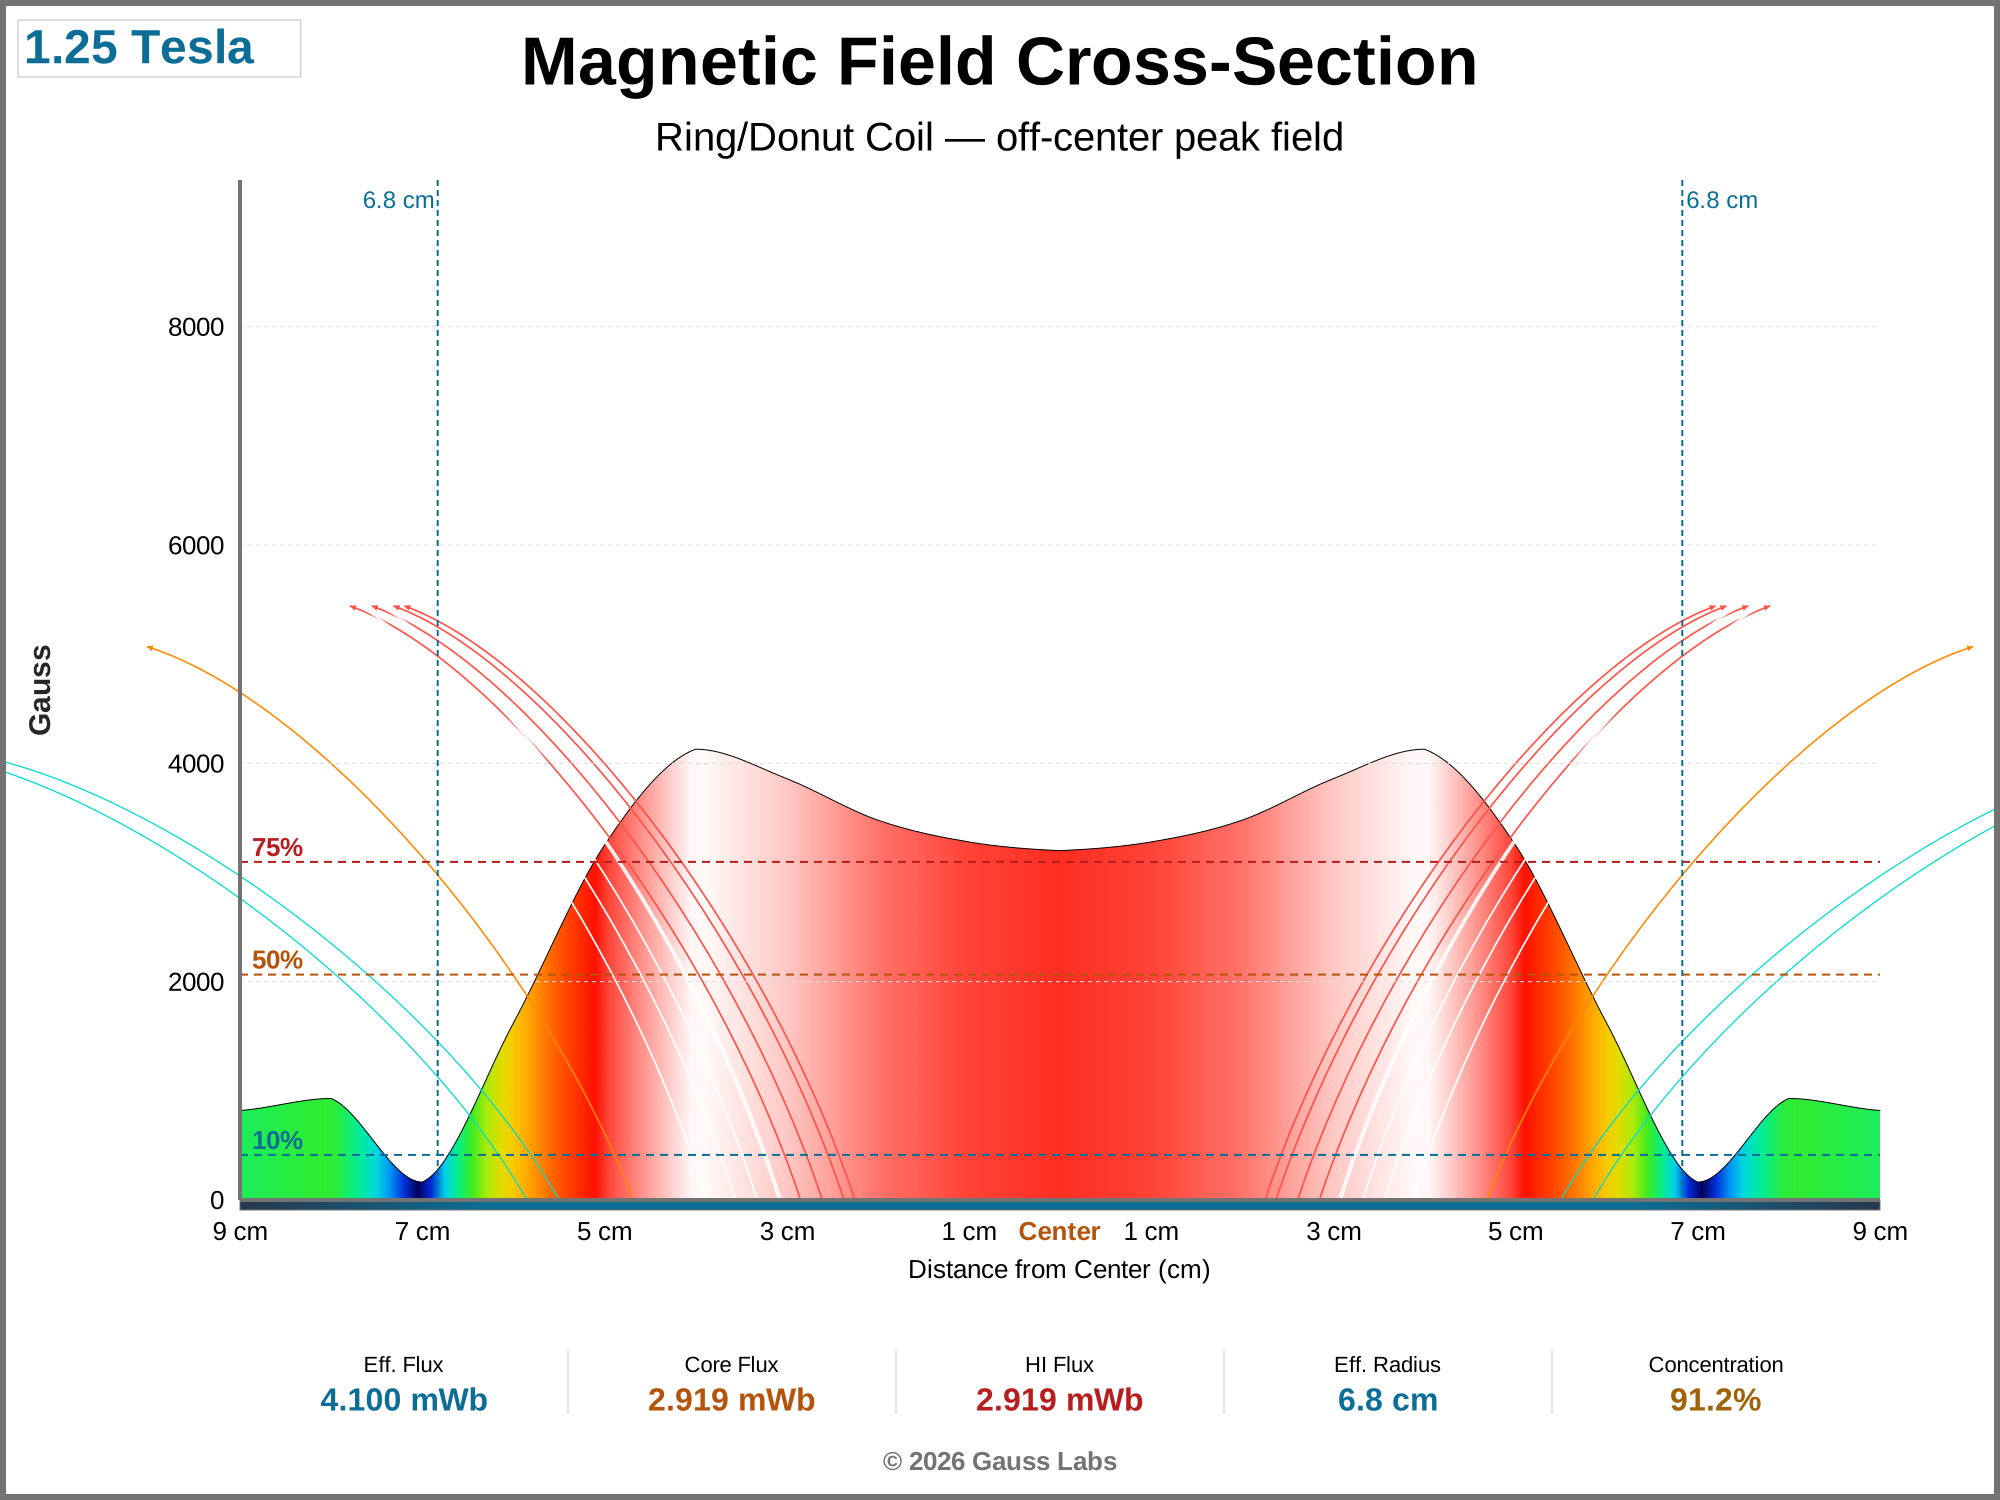
Side view of the field rising out of the accessory surface. Warm colors mark the strongest field; cool colors mark where it falls off toward the edges. The dashed lines flag where the field has dropped to 75%, 50%, and 10% of peak. The curved arrows are flux lines (see Flux Line in the glossary). The Gauss scale is shared across all settings, so a weaker setting's mound sits visibly lower than the strongest.
| Frequency | 1.67 Hz |
| Peak Field Strength | 4.13 kG |
Setting 3 - 1.3 Tesla
Field Cross-Section (surface)
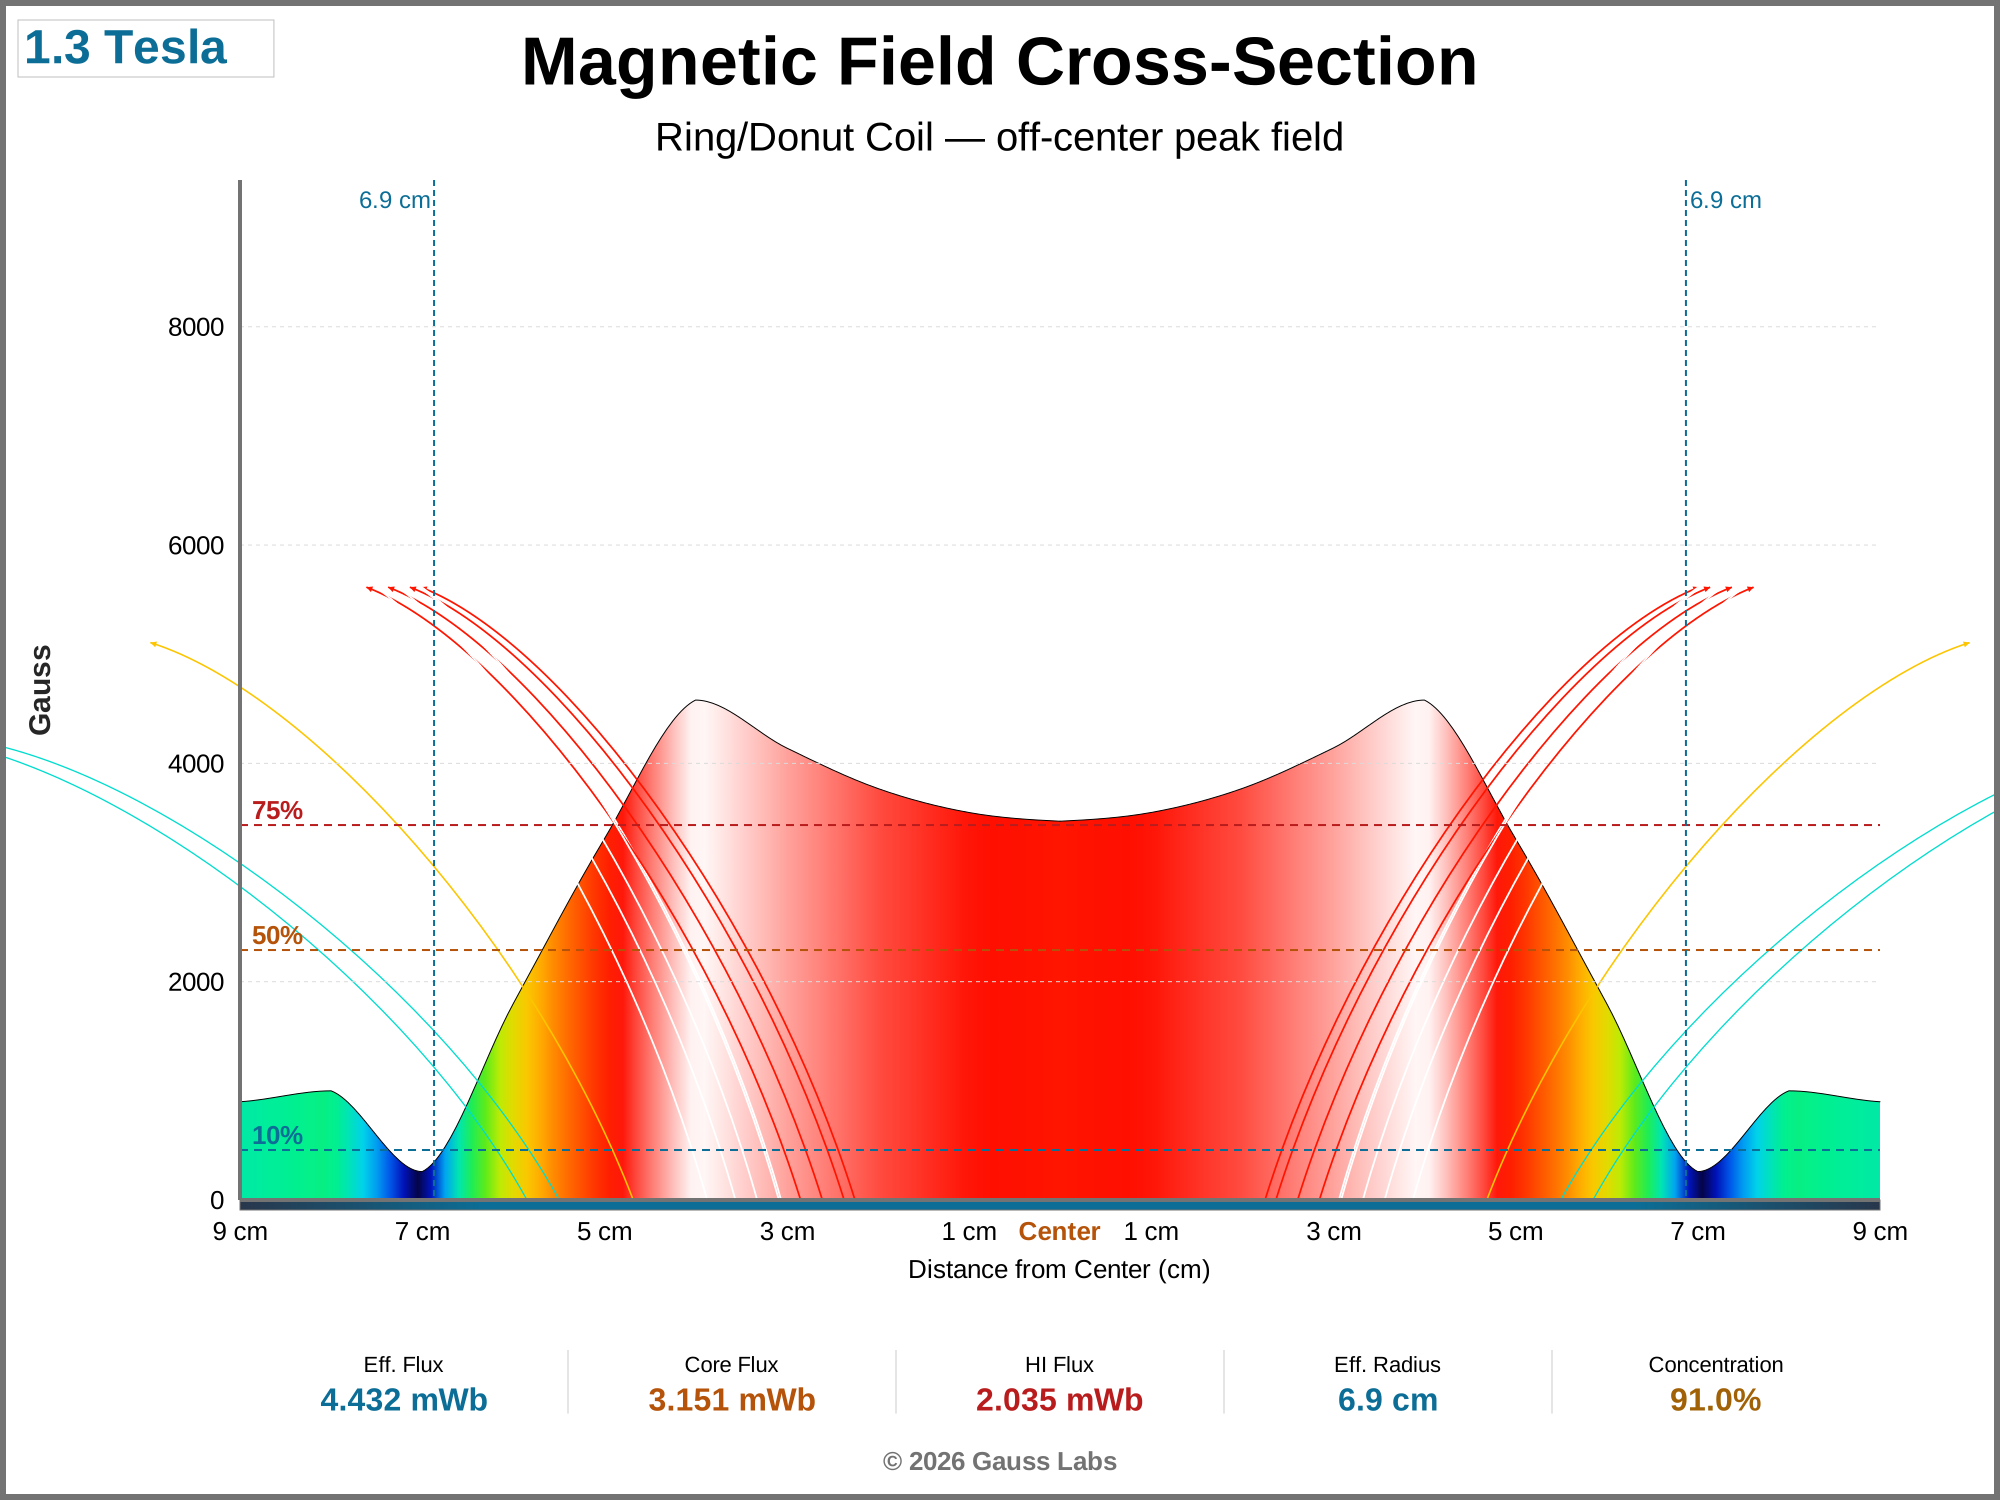
Side view of the field rising out of the accessory surface. Warm colors mark the strongest field; cool colors mark where it falls off toward the edges. The dashed lines flag where the field has dropped to 75%, 50%, and 10% of peak. The curved arrows are flux lines (see Flux Line in the glossary). The Gauss scale is shared across all settings, so a weaker setting's mound sits visibly lower than the strongest.
| Frequency | 1.5 Hz |
| Peak Field Strength | 4.58 kG |
Setting 4 - 1.4 Tesla
Field Cross-Section (surface)
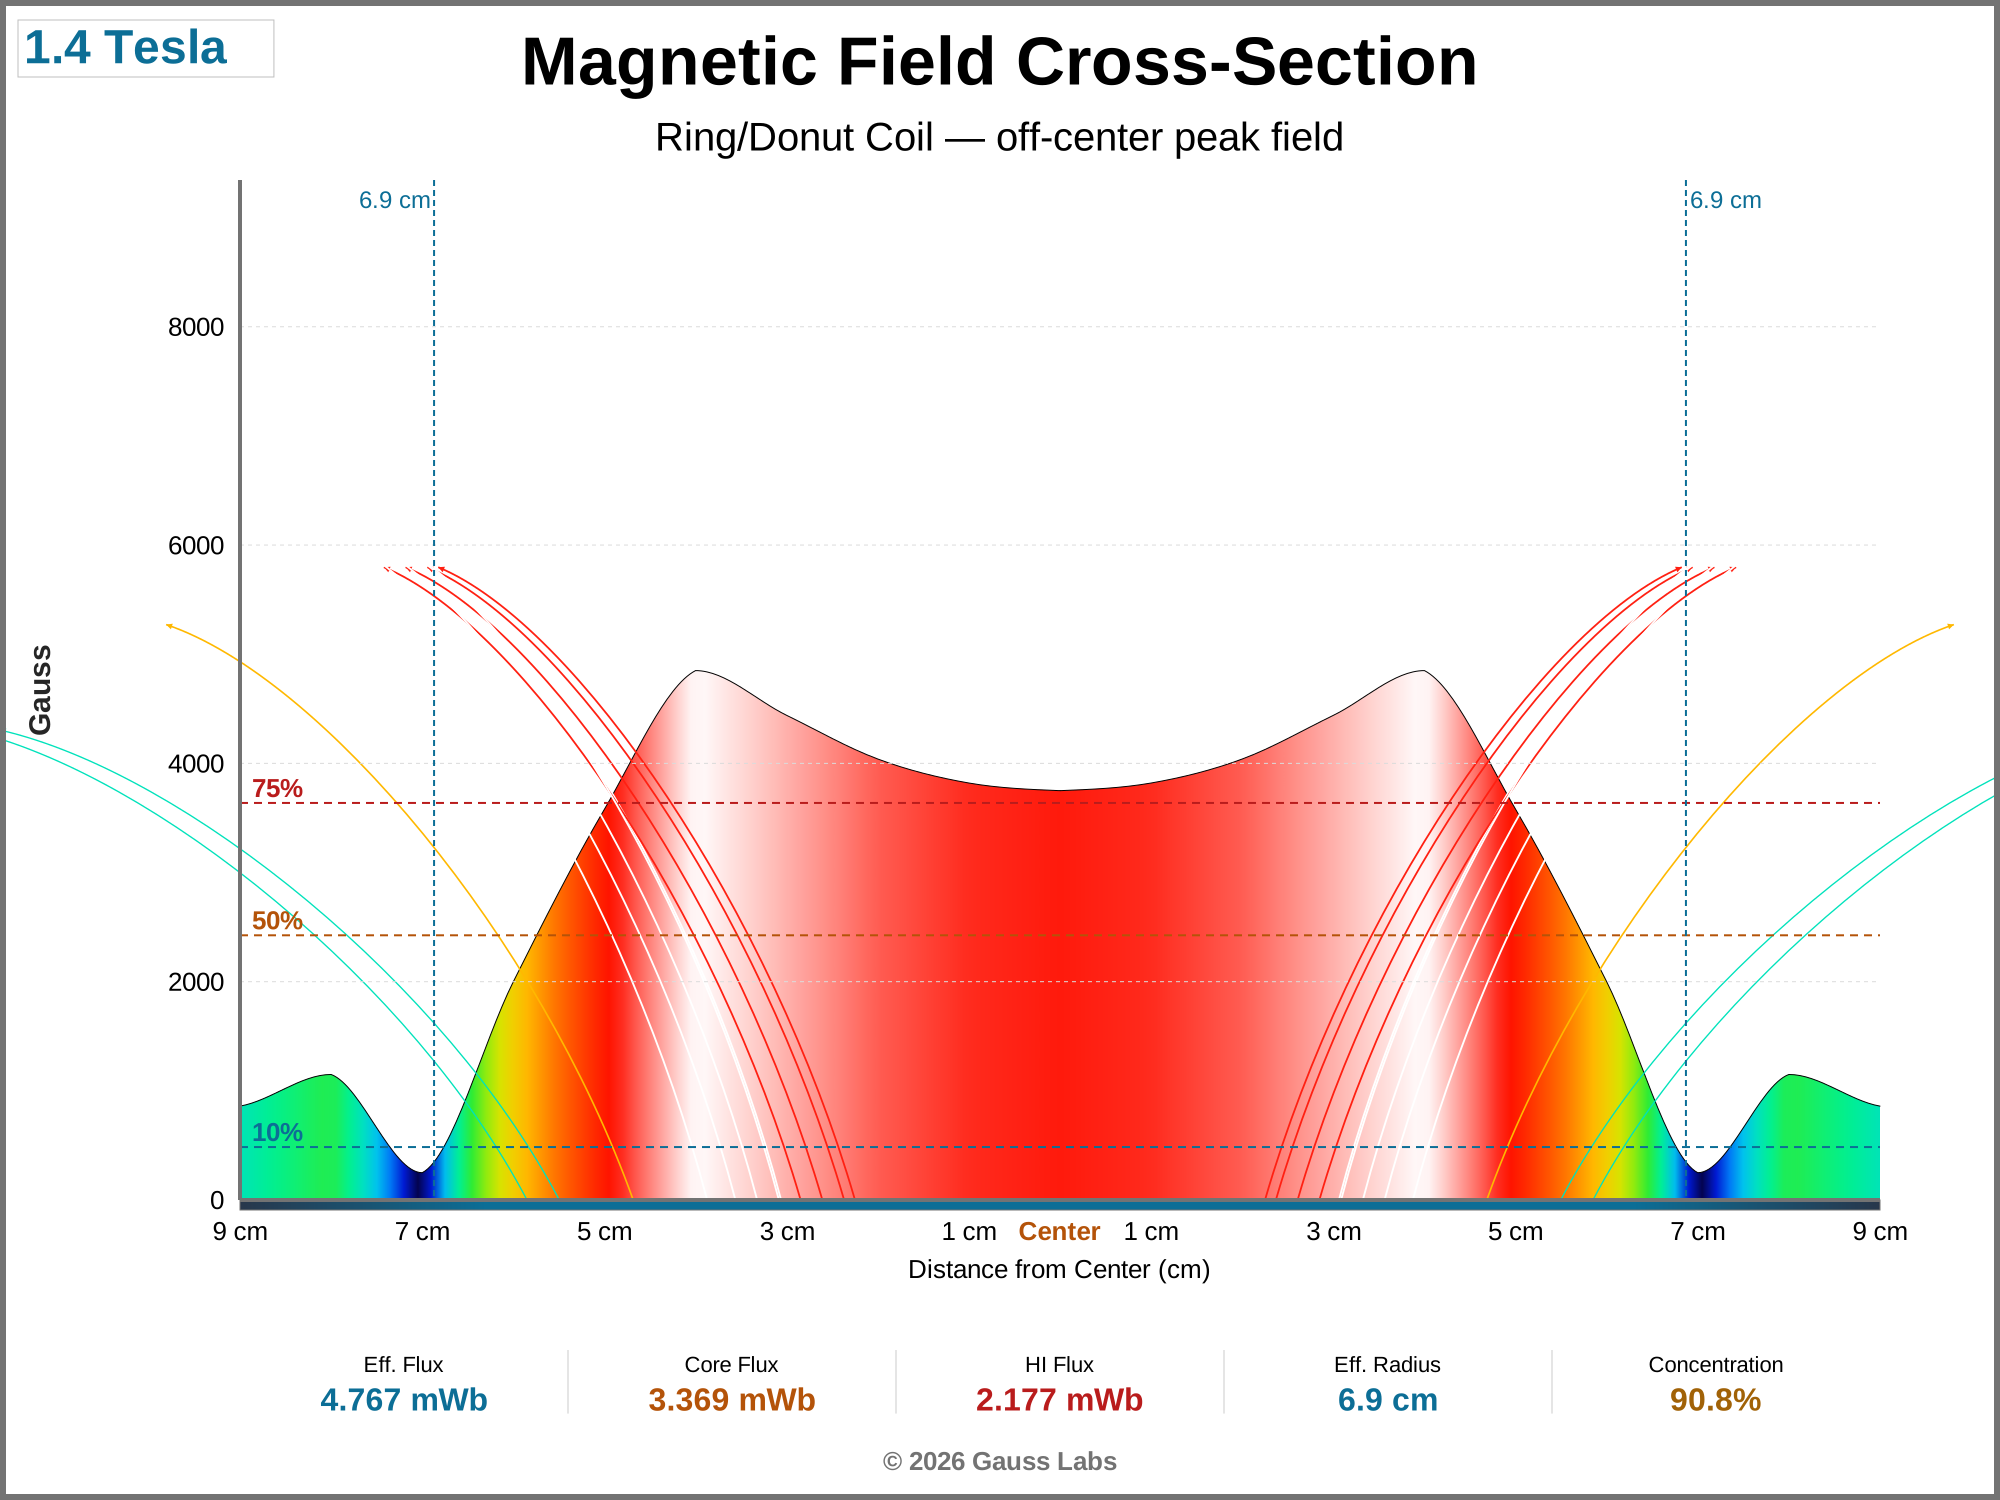
Side view of the field rising out of the accessory surface. Warm colors mark the strongest field; cool colors mark where it falls off toward the edges. The dashed lines flag where the field has dropped to 75%, 50%, and 10% of peak. The curved arrows are flux lines (see Flux Line in the glossary). The Gauss scale is shared across all settings, so a weaker setting's mound sits visibly lower than the strongest.
| Frequency | 1.33 Hz |
| Peak Field Strength | 4.85 kG |
Setting 5 - 1.6 Tesla
Field Cross-Section (surface)
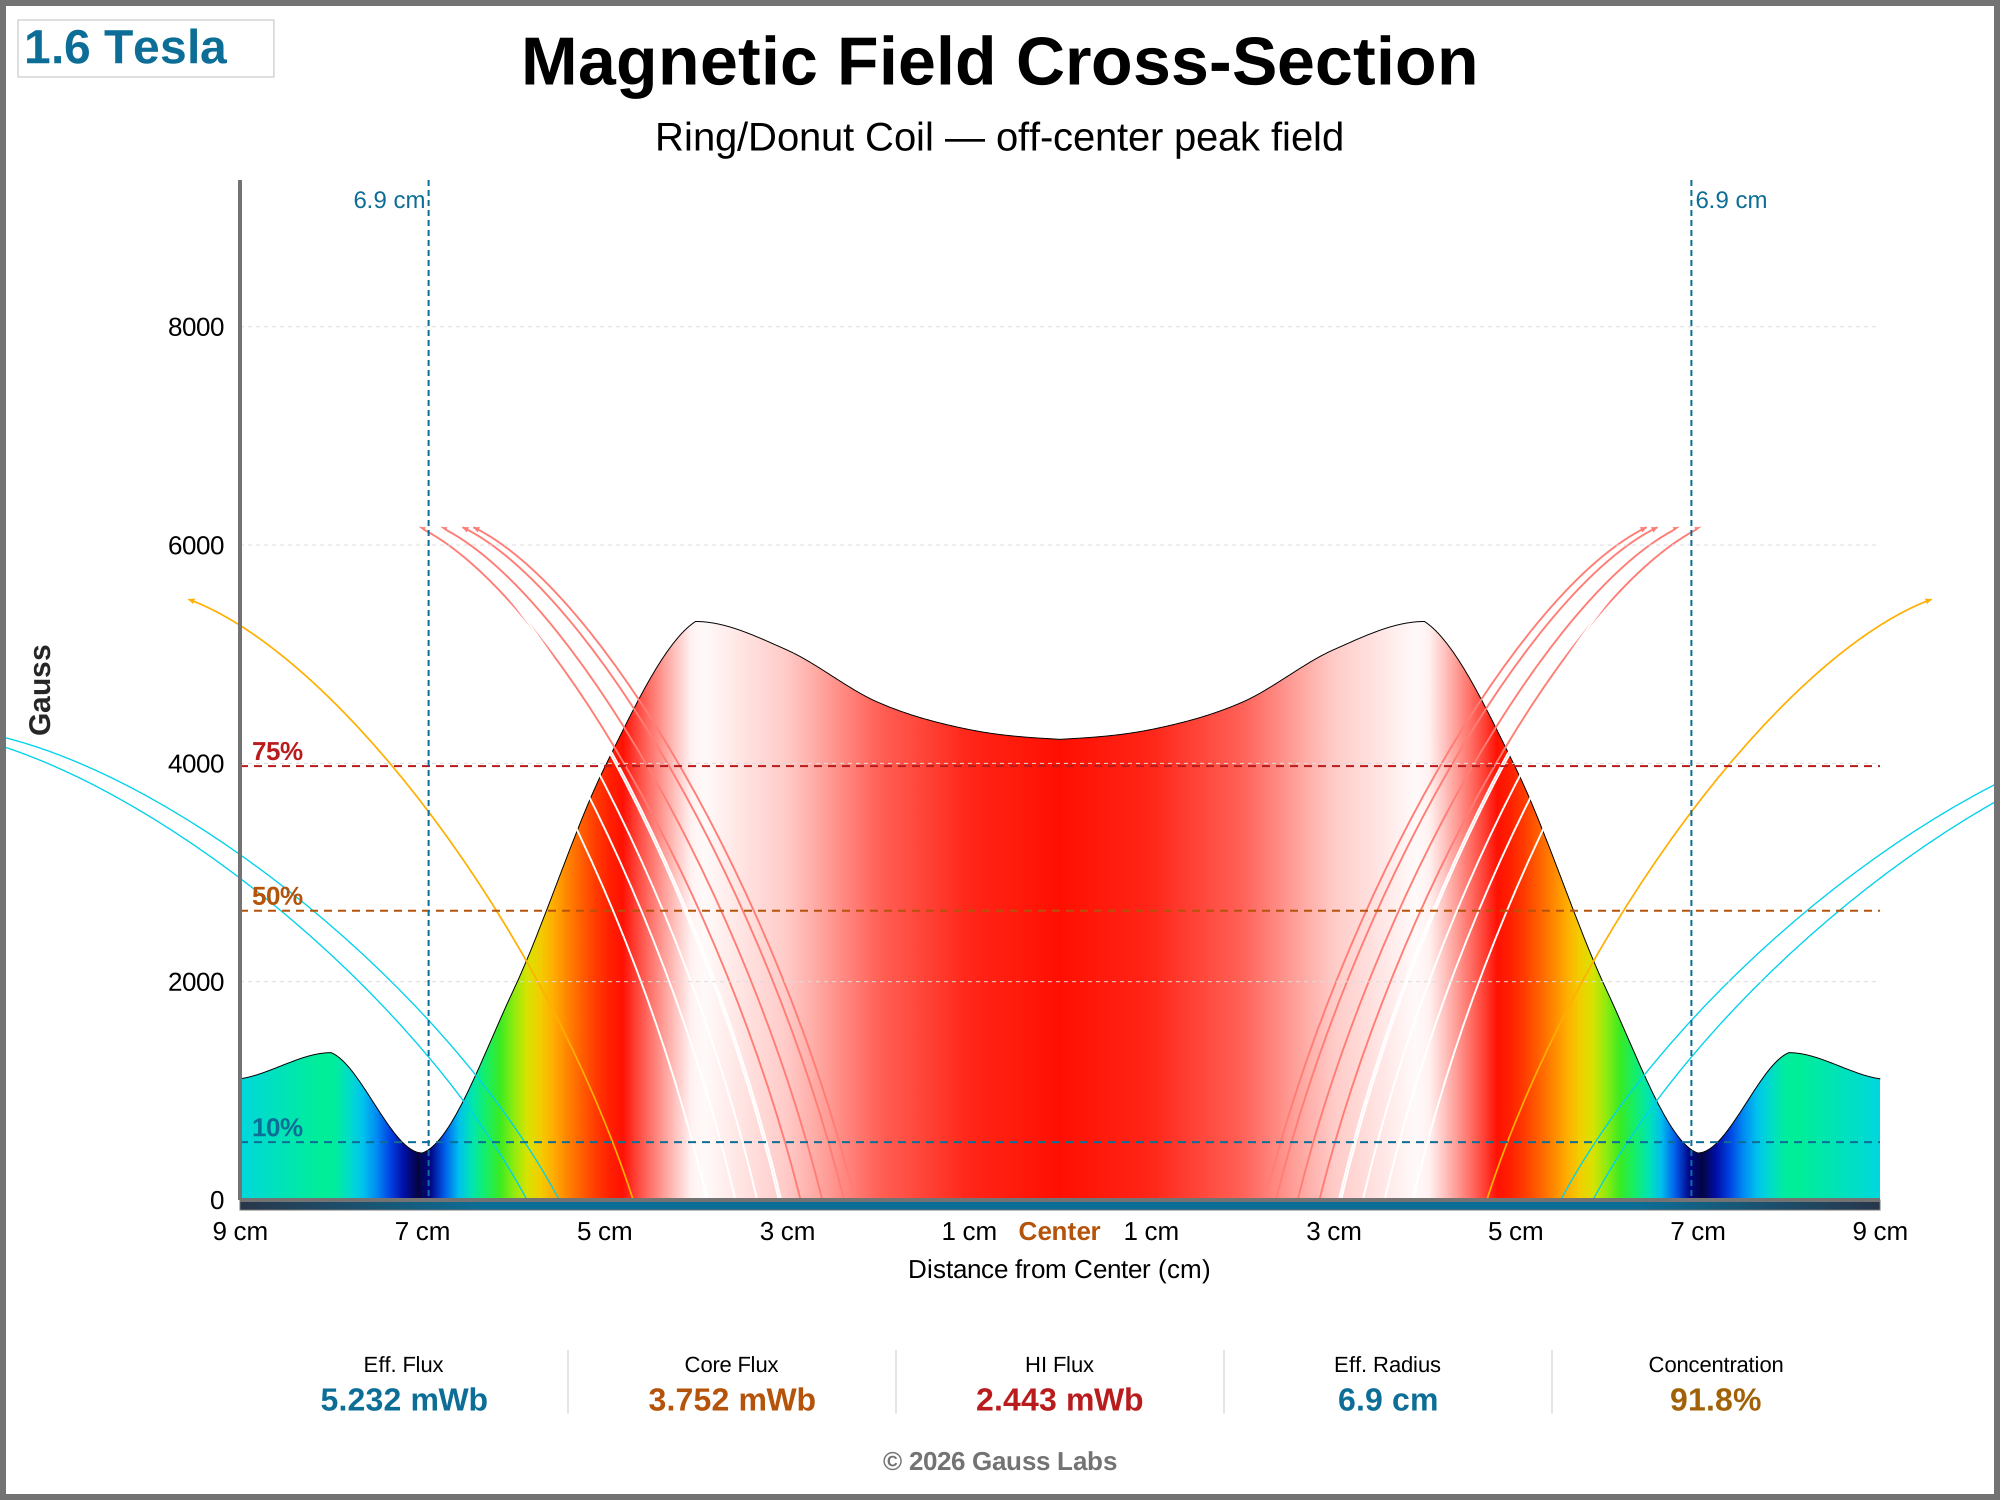
Side view of the field rising out of the accessory surface. Warm colors mark the strongest field; cool colors mark where it falls off toward the edges. The dashed lines flag where the field has dropped to 75%, 50%, and 10% of peak. The curved arrows are flux lines (see Flux Line in the glossary). The Gauss scale is shared across all settings, so a weaker setting's mound sits visibly lower than the strongest.
| Frequency | 1.32 Hz |
| Peak Field Strength | 5.30 kG |
Setting 6 - 1.8 Tesla
Field Cross-Section (surface)
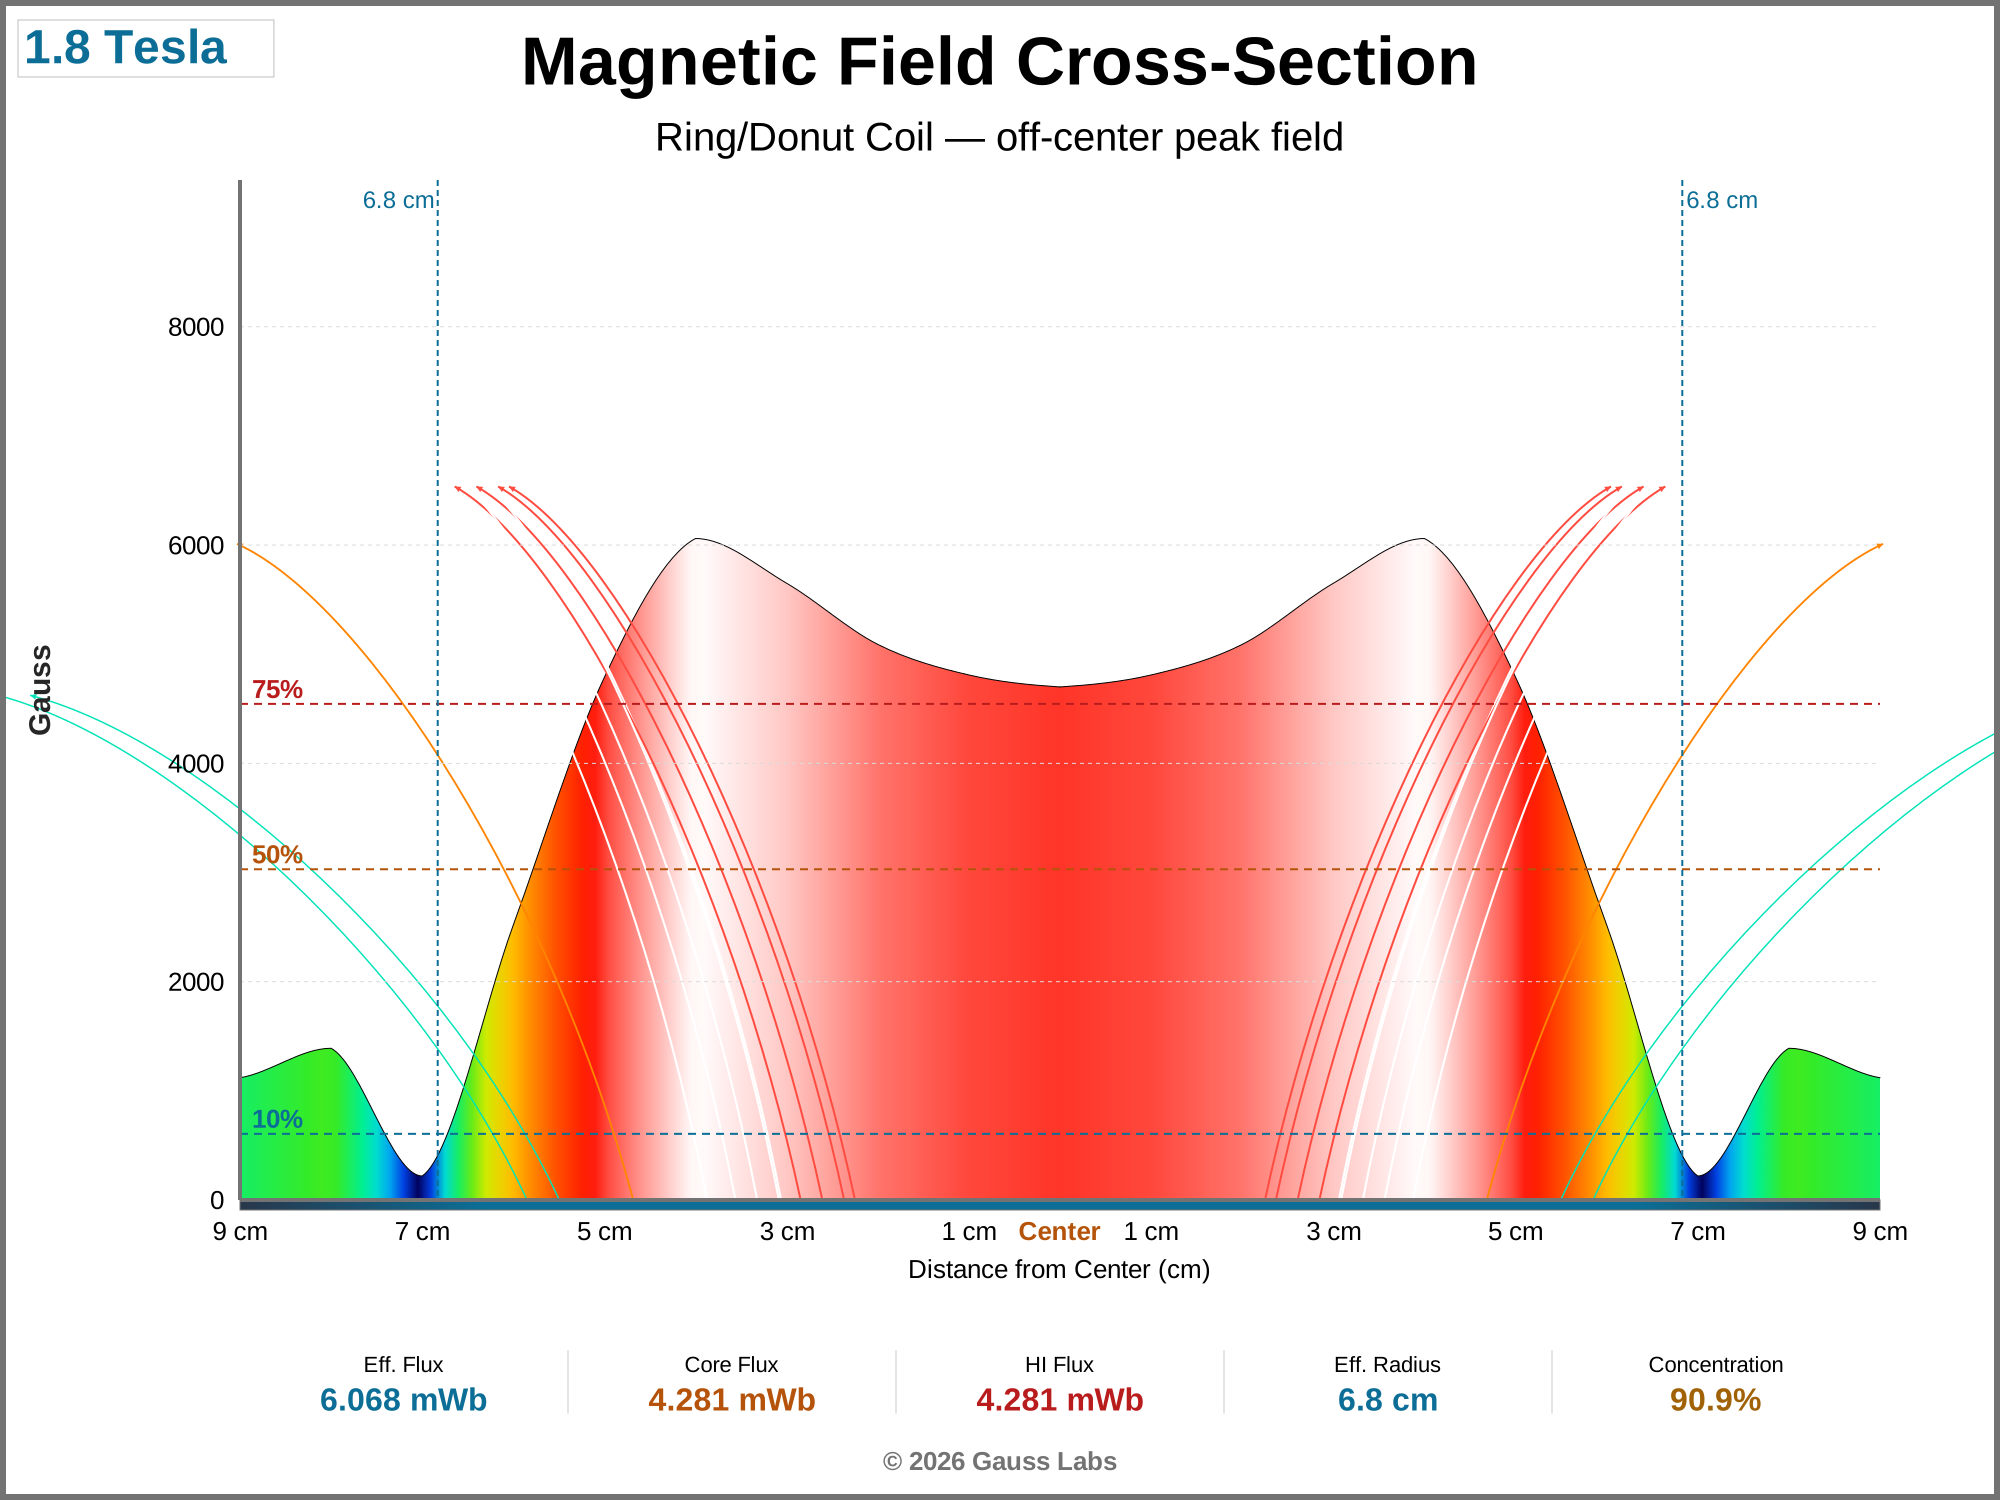
Side view of the field rising out of the accessory surface. Warm colors mark the strongest field; cool colors mark where it falls off toward the edges. The dashed lines flag where the field has dropped to 75%, 50%, and 10% of peak. The curved arrows are flux lines (see Flux Line in the glossary). The Gauss scale is shared across all settings, so a weaker setting's mound sits visibly lower than the strongest.
| Frequency | 0.92 Hz |
| Peak Field Strength | 6.06 kG |
Setting 7 - 2 Tesla
Field Cross-Section (surface)
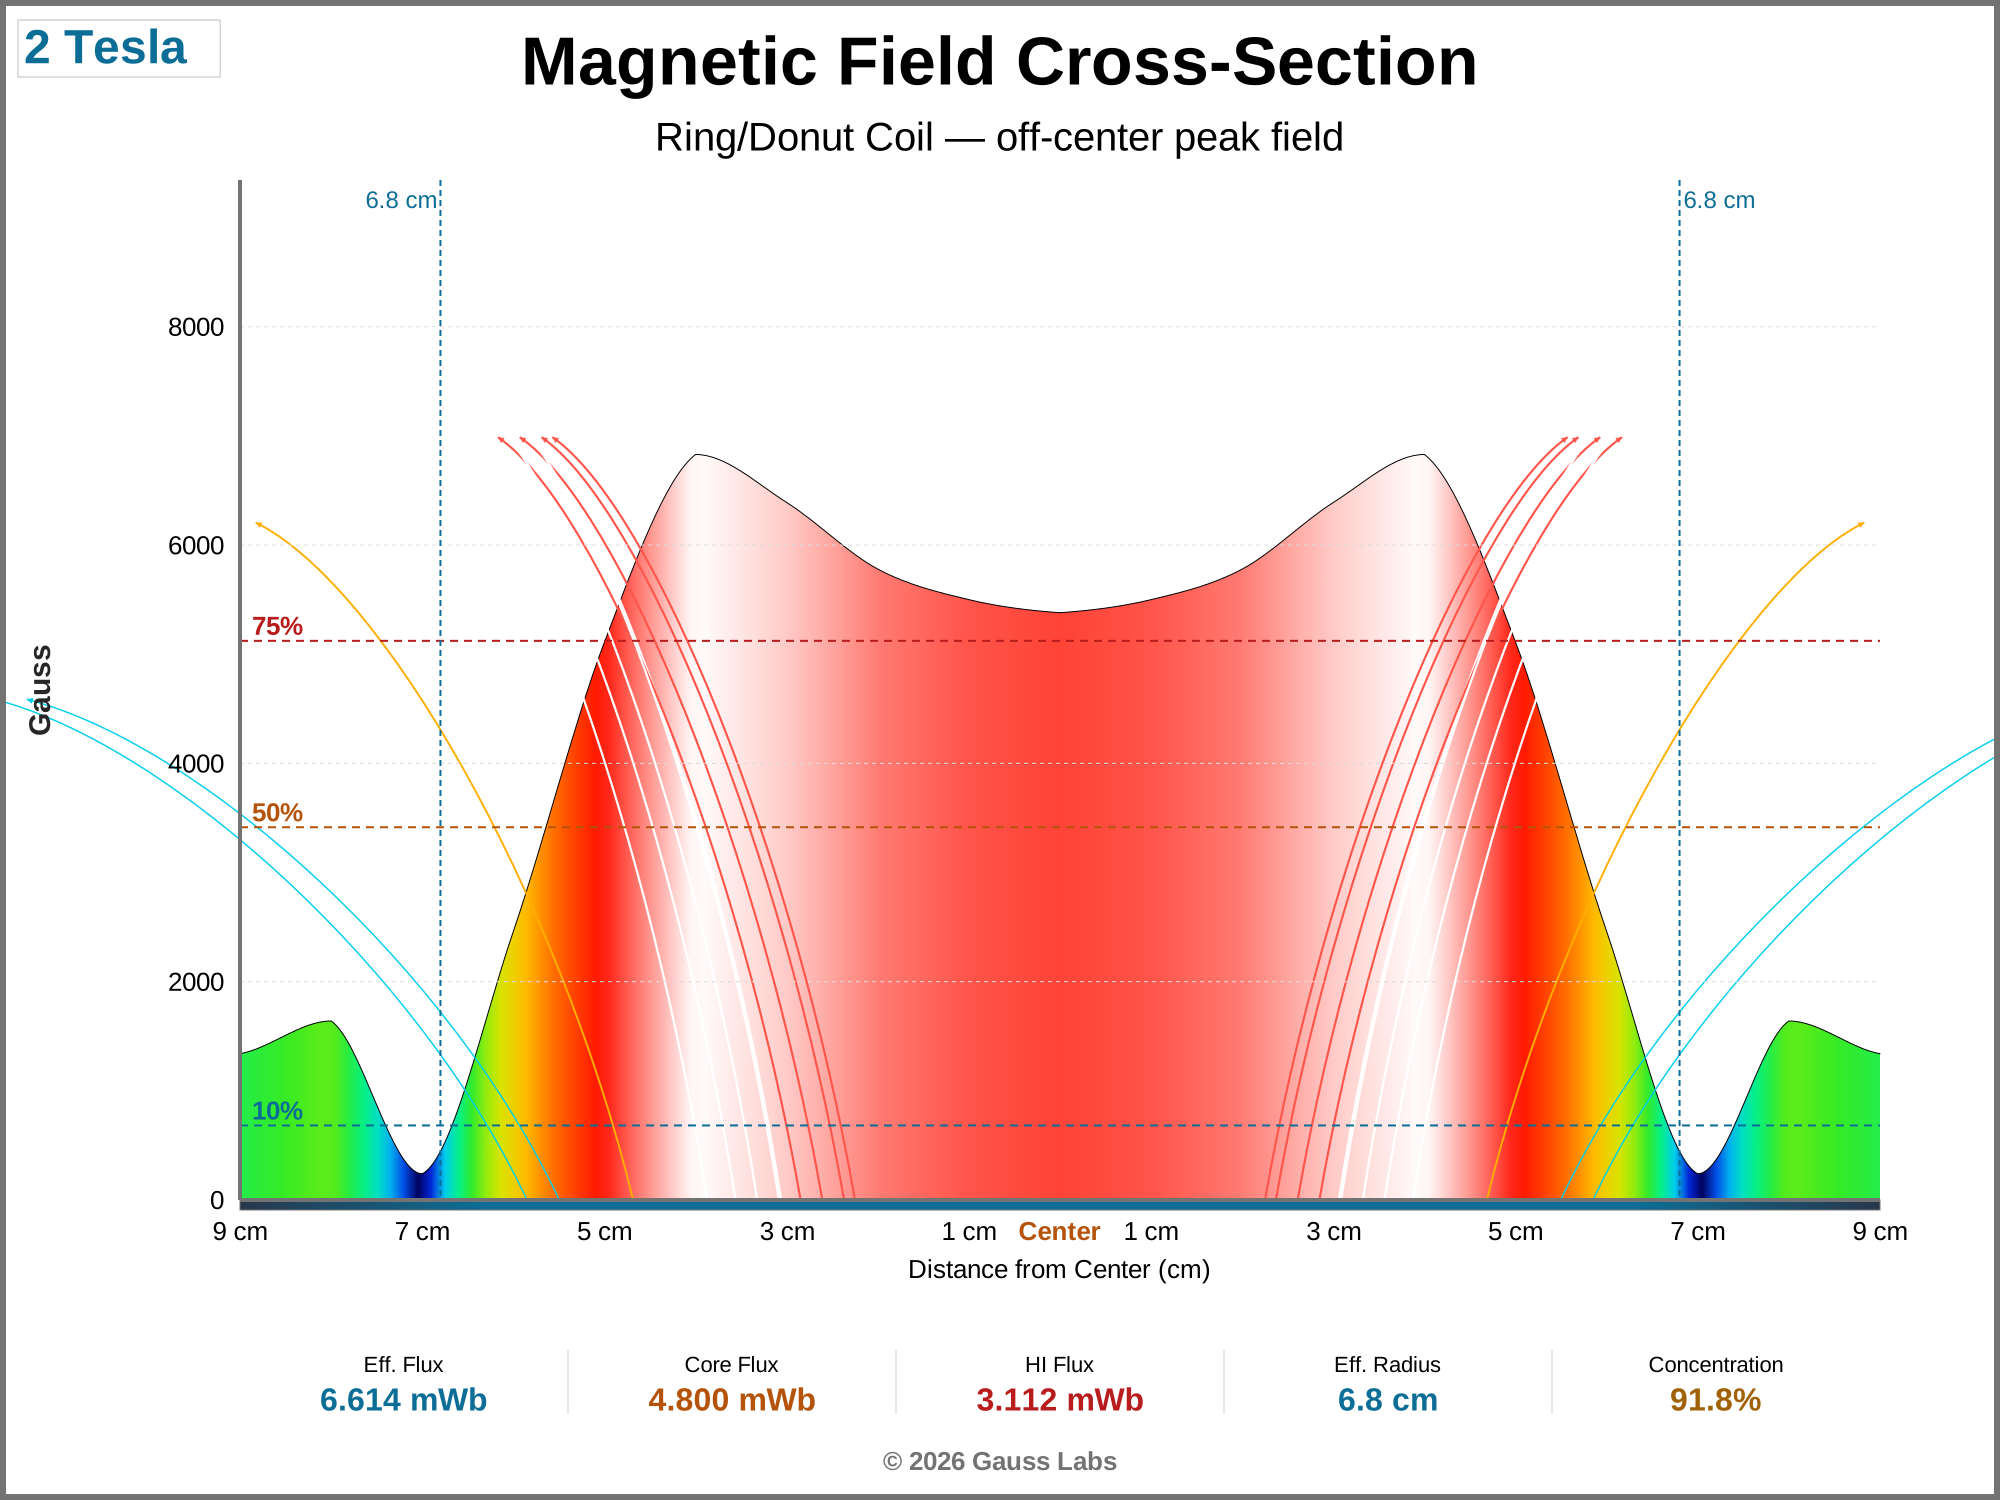
Side view of the field rising out of the accessory surface. Warm colors mark the strongest field; cool colors mark where it falls off toward the edges. The dashed lines flag where the field has dropped to 75%, 50%, and 10% of peak. The curved arrows are flux lines (see Flux Line in the glossary). The Gauss scale is shared across all settings, so a weaker setting's mound sits visibly lower than the strongest.
| Frequency | 0.71 Hz |
| Peak Field Strength | 6.83 kG |
Setting 8 - 2.2 Tesla
Field Cross-Section (surface)
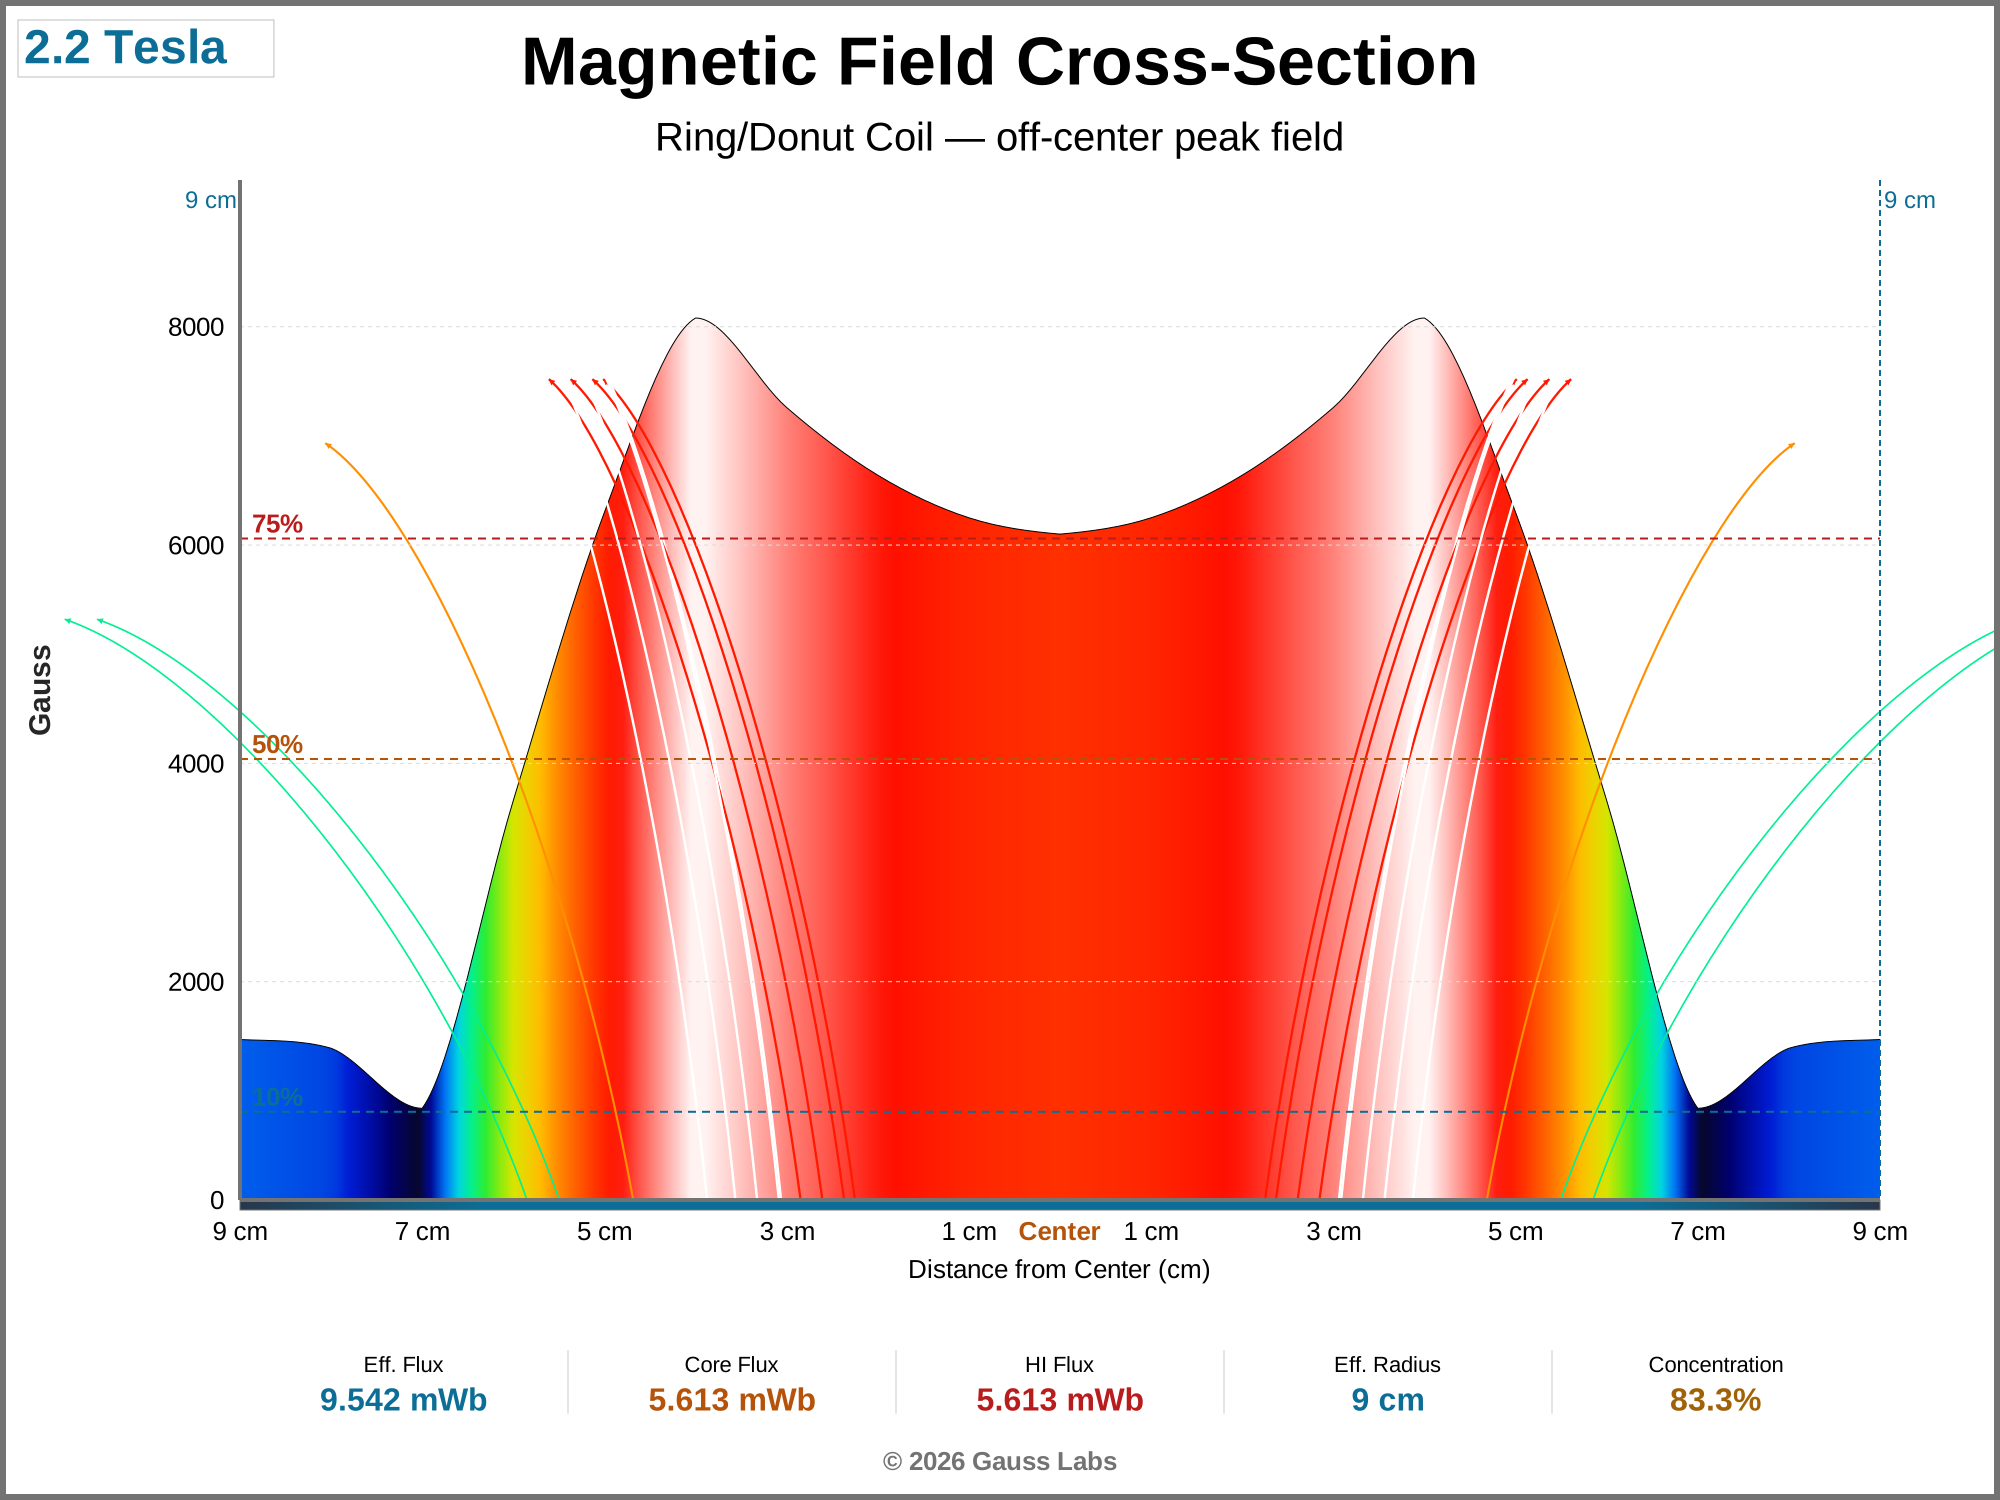
Side view of the field rising out of the accessory surface. Warm colors mark the strongest field; cool colors mark where it falls off toward the edges. The dashed lines flag where the field has dropped to 75%, 50%, and 10% of peak. The curved arrows are flux lines (see Flux Line in the glossary). The Gauss scale is shared across all settings, so a weaker setting's mound sits visibly lower than the strongest.
| Frequency | 0.49 Hz |
| Peak Field Strength | 8.08 kG |
Setting 9 - 2.4 Tesla
Field Cross-Section (surface)
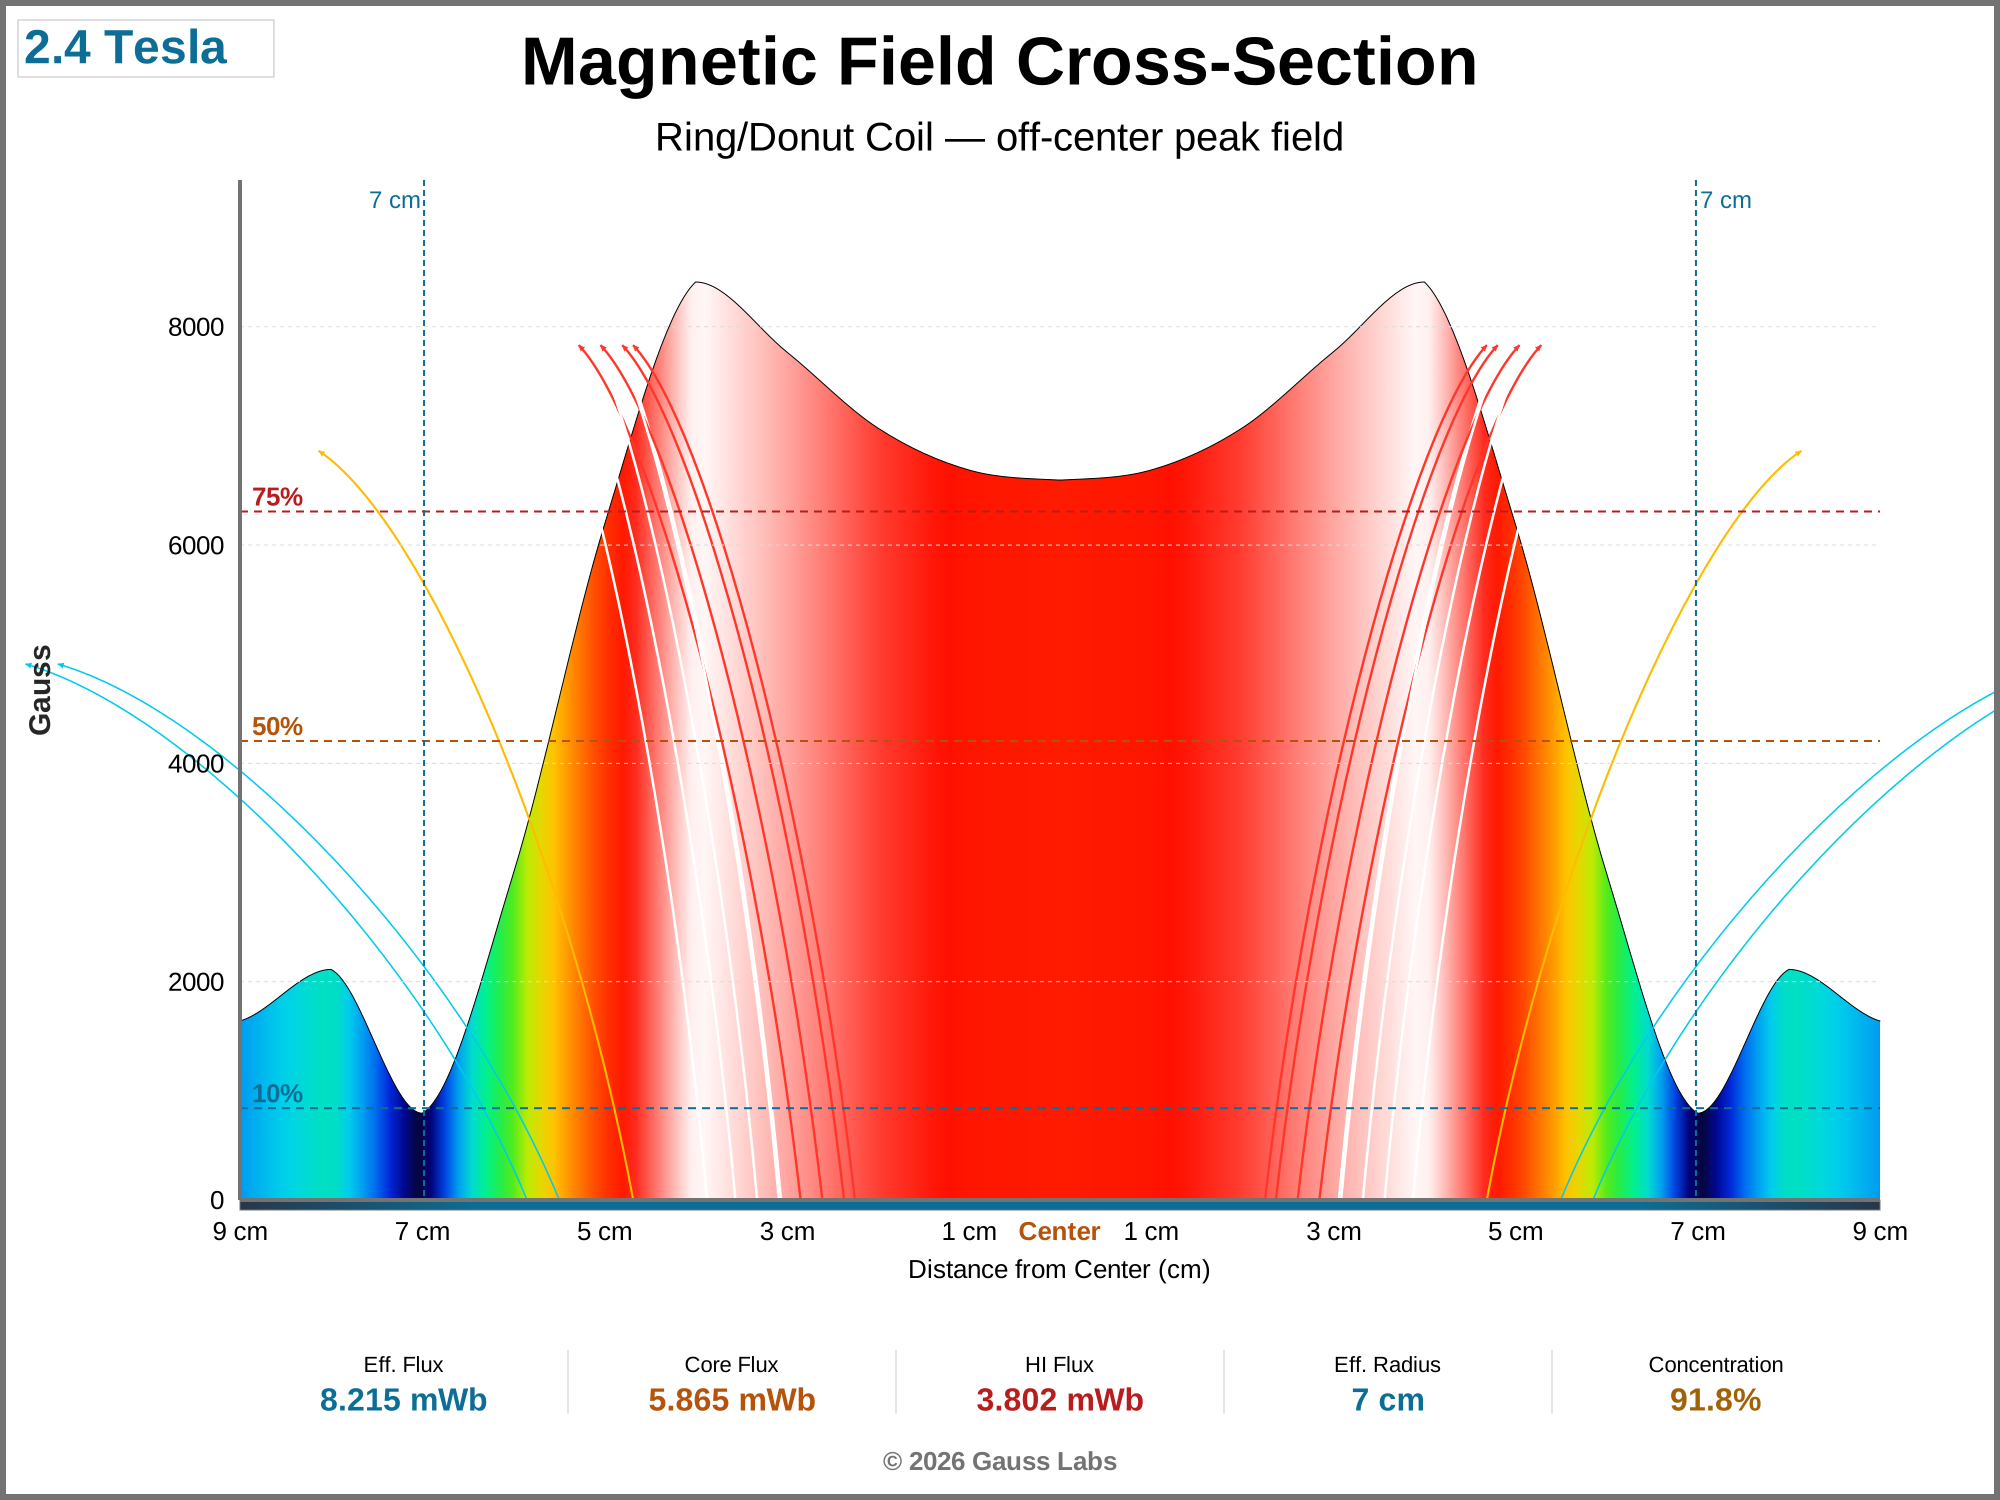
Side view of the field rising out of the accessory surface. Warm colors mark the strongest field; cool colors mark where it falls off toward the edges. The dashed lines flag where the field has dropped to 75%, 50%, and 10% of peak. The curved arrows are flux lines (see Flux Line in the glossary). The Gauss scale is shared across all settings, so a weaker setting's mound sits visibly lower than the strongest.
Field Heatmap (surface)
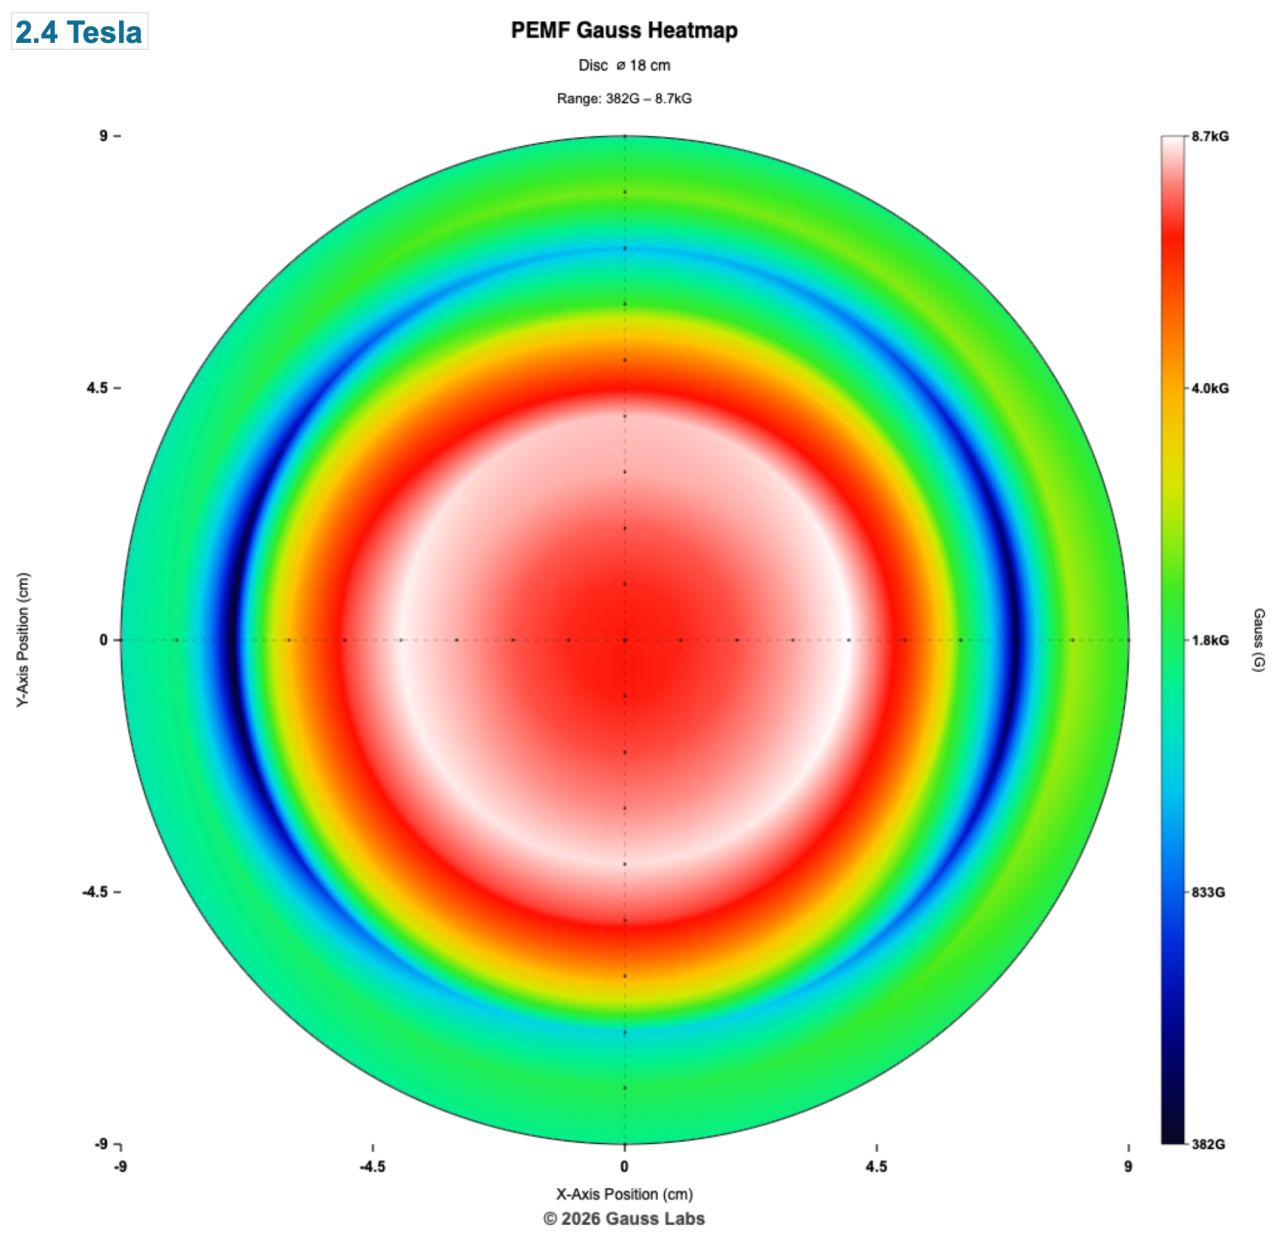
Top-down view of the field strength across the accessory surface. Warm colors represent higher Gauss; cool colors represent lower Gauss. The color scale spans this setting's own peak, so the spatial pattern reads clearly even on weaker settings.
| Frequency | 0.4 Hz |
| Peak Field Strength | 8.67 kG |
Test Setup & Methodology
The test engineer measured each setting on calibrated laboratory instruments, recording the field strength, the waveform, and the supporting electrical readings. Conditions stayed consistent from one setting to the next, so the numbers compare cleanly across the report.
Scan Grid
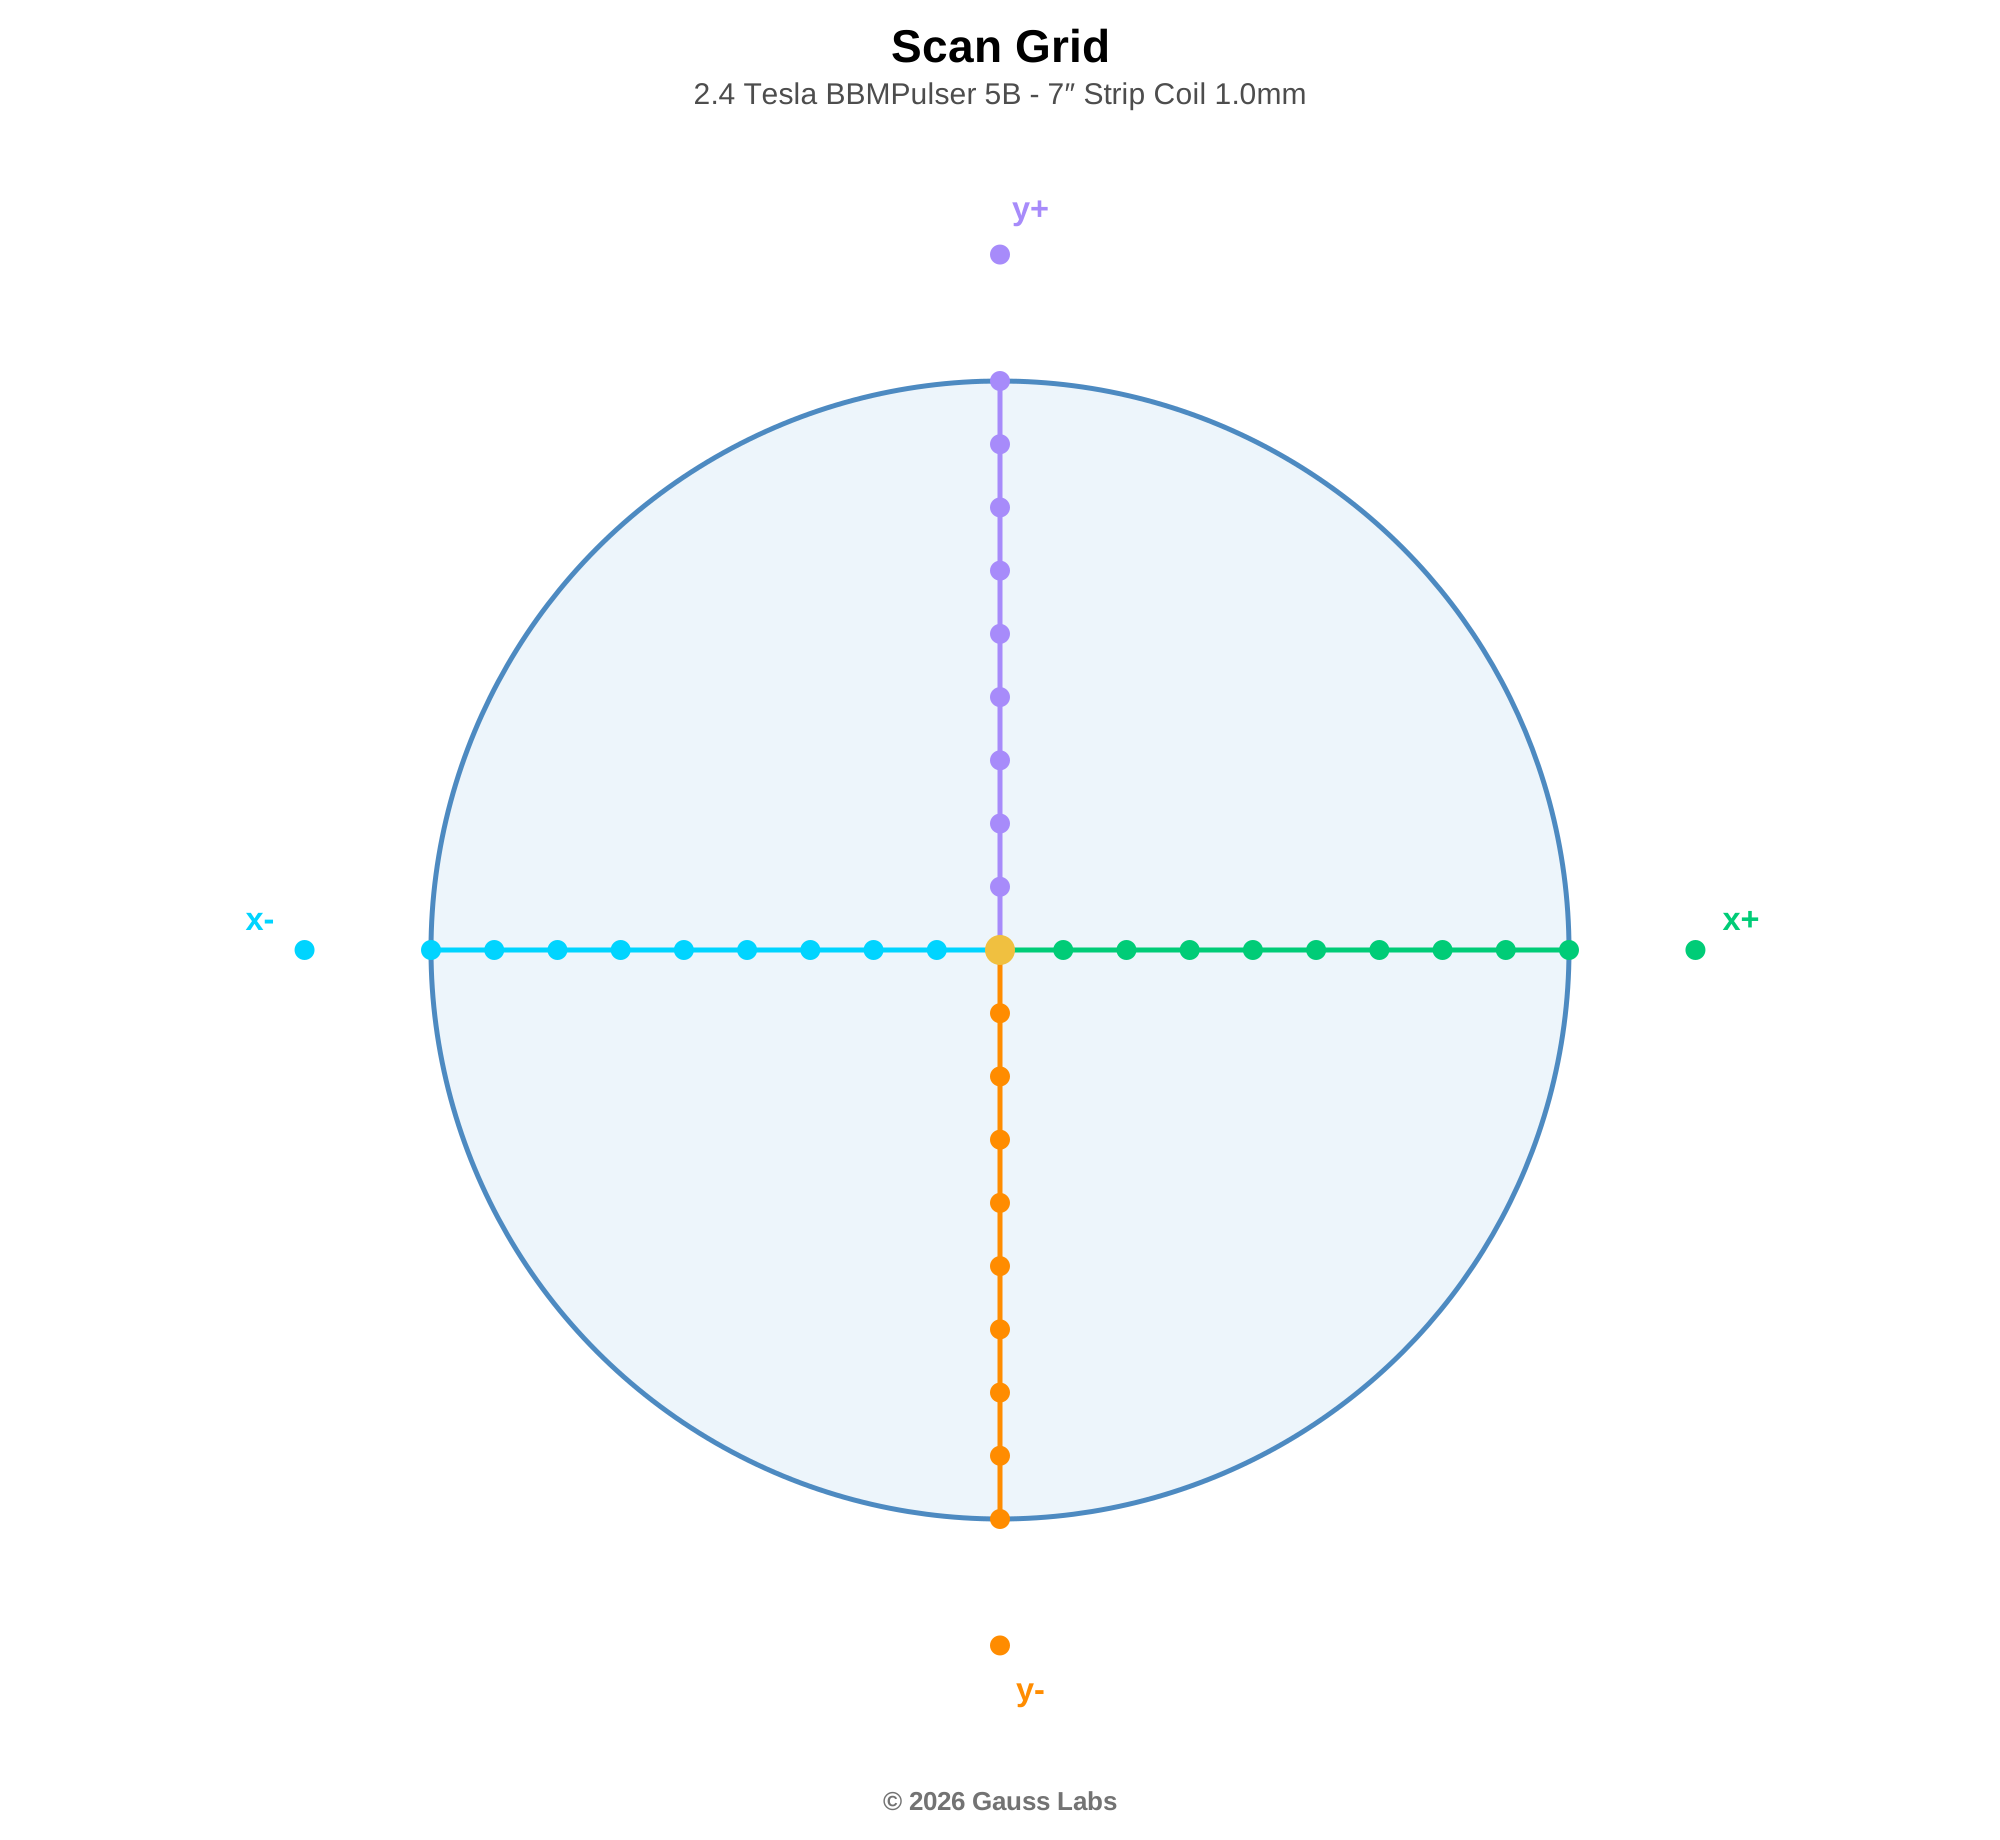
The diagram shows the accessory outline and the points along each axis where the test engineer placed the probe. The colored lines mark the four scan axes; the dots along each line are the probe positions.
Device/Accessory Information
| Analysis Date | June 17, 2026 |
|---|---|
| Device Under Test | 2.4 Tesla BBMPulser 5B |
| Applicator / Accessory | 7″ Strip Coil 1.0mm |
| Settings Tested | 9 settings |
| Frequency Range | 0 Hz to 2 Hz |
Equipment
| Gauss Meter | FW Bell 5180 |
|---|---|
| Gauss Meter Probe | FW Bell Axial |
| LCR Meter | FNIRSI LC1020E |
Gauss Meter Probe: Gauss Meter Probe
LCR Meter: LCR Meter
Test Parameters
| Accessory Shape | Disc (Round) |
|---|---|
| Measured Axes | X-, X+, Y-, Y+ |
| Scan Lines | 4 |
| Points per Scan Line | 10 |
| Total Scan Points | 37 |
| Max Distance from Center | 9 cm |
| Point Spacing | 1 cm |
Manufacturing Tolerance
A measured value won't always match the documented specification to the decimal, and that's expected. No two units come off a line exactly alike. Small differences in the parts, and in the wall power feeding the device, add up. In most cases they produce a 10% to 20% difference from that figure, and up to 30% in some. A reading in that range is normal.
The numbers in this report come from the specific unit and accessory the test engineer measured, under the conditions documented above. Another unit of the same model should land in a similar range, not with the exact same measurements.
Measurement Data
Per-setting measurement detail follows. Each setting is presented with the readings sheet data and the spatial scan grid grouped by z-plane.
Setting 1: 1.2 Tesla
Axes: rows below organise the four horizontal scan axes (x-, x+, y-, y+) plus the Center reading.
| Frequency (Hz) | 1.76 Hz |
| Peak Field Strength | 4.17 kG |
| Location | Gauss (G) |
|---|---|
| x- 0 cm | 3,080 |
| x- 1 cm (0.4 in) | 3,150 |
| x- 2 cm (0.8 in) | 3,370 |
| x- 3 cm (1.2 in) | 3,760 |
| x- 4 cm (1.6 in) | 4,170 |
| x- 5 cm (2 in) | 3,390 |
| x- 6 cm (2.4 in) | 1,720 |
| x- 7 cm (2.8 in) | 260 |
| x- 8 cm (3.1 in) | 880 |
| x- 9 cm (3.5 in) | 740 |
Setting 2: 1.25 Tesla
Axes: rows below organise the four horizontal scan axes (x-, x+, y-, y+) plus the Center reading.
| Frequency (Hz) | 1.67 Hz |
| Peak Field Strength | 4.13 kG |
| Location | Gauss (G) |
|---|---|
| x- 0 cm | 3,200 |
| x- 1 cm (0.4 in) | 3,280 |
| x- 2 cm (0.8 in) | 3,480 |
| x- 3 cm (1.2 in) | 3,860 |
| x- 4 cm (1.6 in) | 4,130 |
| x- 5 cm (2 in) | 3,250 |
| x- 6 cm (2.4 in) | 1,620 |
| x- 7 cm (2.8 in) | 164 |
| x- 8 cm (3.1 in) | 930 |
| x- 9 cm (3.5 in) | 820 |
Setting 3: 1.3 Tesla
Axes: rows below organise the four horizontal scan axes (x-, x+, y-, y+) plus the Center reading.
| Frequency (Hz) | 1.50 Hz |
| Peak Field Strength | 4.58 kG |
| Location | Gauss (G) |
|---|---|
| x- 0 cm | 3,470 |
| x- 1 cm (0.4 in) | 3,550 |
| x- 2 cm (0.8 in) | 3,770 |
| x- 3 cm (1.2 in) | 4,141 |
| x- 4 cm (1.6 in) | 4,580 |
| x- 5 cm (2 in) | 3,310 |
| x- 6 cm (2.4 in) | 1,800 |
| x- 7 cm (2.8 in) | 260 |
| x- 8 cm (3.1 in) | 1,000 |
| x- 9 cm (3.5 in) | 900 |
Setting 4: 1.4 Tesla
Axes: rows below organise the four horizontal scan axes (x-, x+, y-, y+) plus the Center reading.
| Frequency (Hz) | 1.33 Hz |
| Peak Field Strength | 4.85 kG |
| Location | Gauss (G) |
|---|---|
| x- 0 cm | 3,750 |
| x- 1 cm (0.4 in) | 3,820 |
| x- 2 cm (0.8 in) | 4,040 |
| x- 3 cm (1.2 in) | 4,440 |
| x- 4 cm (1.6 in) | 4,850 |
| x- 5 cm (2 in) | 3,580 |
| x- 6 cm (2.4 in) | 2,000 |
| x- 7 cm (2.8 in) | 250 |
| x- 8 cm (3.1 in) | 1,150 |
| x- 9 cm (3.5 in) | 860 |
Setting 5: 1.6 Tesla
Axes: rows below organise the four horizontal scan axes (x-, x+, y-, y+) plus the Center reading.
| Frequency (Hz) | 1.32 Hz |
| Peak Field Strength | 5.3 kG |
| Location | Gauss (G) |
|---|---|
| x- 0 cm | 4,220 |
| x- 1 cm (0.4 in) | 4,310 |
| x- 2 cm (0.8 in) | 4,560 |
| x- 3 cm (1.2 in) | 5,040 |
| x- 4 cm (1.6 in) | 5,300 |
| x- 5 cm (2 in) | 3,960 |
| x- 6 cm (2.4 in) | 1,920 |
| x- 7 cm (2.8 in) | 430 |
| x- 8 cm (3.1 in) | 1,350 |
| x- 9 cm (3.5 in) | 1,110 |
Setting 6: 1.8 Tesla
Axes: rows below organise the four horizontal scan axes (x-, x+, y-, y+) plus the Center reading.
| Frequency (Hz) | 0.92 Hz |
| Peak Field Strength | 6.06 kG |
| Location | Gauss (G) |
|---|---|
| x- 0 cm | 4,700 |
| x- 1 cm (0.4 in) | 4,810 |
| x- 2 cm (0.8 in) | 5,090 |
| x- 3 cm (1.2 in) | 5,650 |
| x- 4 cm (1.6 in) | 6,060 |
| x- 5 cm (2 in) | 4,790 |
| x- 6 cm (2.4 in) | 2,520 |
| x- 7 cm (2.8 in) | 220 |
| x- 8 cm (3.1 in) | 1,390 |
| x- 9 cm (3.5 in) | 1,120 |
Setting 7: 2 Tesla
Axes: rows below organise the four horizontal scan axes (x-, x+, y-, y+) plus the Center reading.
| Frequency (Hz) | 0.71 Hz |
| Peak Field Strength | 6.83 kG |
| Location | Gauss (G) |
|---|---|
| x- 0 cm | 5,380 |
| x- 1 cm (0.4 in) | 5,500 |
| x- 2 cm (0.8 in) | 5,780 |
| x- 3 cm (1.2 in) | 6,390 |
| x- 4 cm (1.6 in) | 6,830 |
| x- 5 cm (2 in) | 5,110 |
| x- 6 cm (2.4 in) | 2,460 |
| x- 7 cm (2.8 in) | 240 |
| x- 8 cm (3.1 in) | 1,640 |
| x- 9 cm (3.5 in) | 1,340 |
Setting 8: 2.2 Tesla
Axes: rows below organise the four horizontal scan axes (x-, x+, y-, y+) plus the Center reading.
| Frequency (Hz) | 0.49 Hz |
| Peak Field Strength | 8.08 kG |
| Location | Gauss (G) |
|---|---|
| x- 0 cm | 6,100 |
| x- 1 cm (0.4 in) | 6,250 |
| x- 2 cm (0.8 in) | 6,640 |
| x- 3 cm (1.2 in) | 7,260 |
| x- 4 cm (1.6 in) | 8,080 |
| x- 5 cm (2 in) | 6,300 |
| x- 6 cm (2.4 in) | 3,660 |
| x- 7 cm (2.8 in) | 840 |
| x- 8 cm (3.1 in) | 1,390 |
| x- 9 cm (3.5 in) | 1,470 |
Setting 9: 2.4 Tesla
Axes: rows below organise the four horizontal scan axes (x-, x+, y-, y+) plus the Center reading.
| Frequency (Hz) | 0.40 Hz |
| Peak Field Strength | 8.67 kG |
| Distance | x-axis - (G) | x-axis + (G) | y-axis - (G) | y-axis + (G) |
|---|---|---|---|---|
| Center | 6.62 kG | 6.62 kG | 6.62 kG | 6.62 kG |
| 1 cm (0.4 in) | 6.71 kG | 6.69 kG | 6.62 kG | 6.73 kG |
| 2 cm (0.8 in) | 7.1 kG | 7.05 kG | 6.98 kG | 7.16 kG |
| 3 cm (1.2 in) | 7.87 kG | 7.79 kG | 7.54 kG | 7.88 kG |
| 4 cm (1.6 in) | 8.55 kG | 8.67 kG | 8.34 kG | 8.08 kG |
| 5 cm (2 in) | 6.87 kG | 6.04 kG | 6.96 kG | 4.87 kG |
| 6 cm (2.4 in) | 3.71 kG | 2.08 kG | 4.06 kG | 2.11 kG |
| 7 cm (2.8 in) | 380 G | 440 G | 1.25 kG | 1.11 kG |
| 8 cm (3.1 in) | 1.67 kG | 2.56 kG | 1.87 kG | 2.35 kG |
| 9 cm (3.5 in) | 1.42 kG | 1.97 kG | 1.61 kG | 1.56 kG |
References
Primary sources behind the measurements and methods in this report.
- Barker AT. An introduction to the basic principles of magnetic nerve stimulation. J Clin Neurophysiol. 1991;8(1):26-37.
- Bassett CAL, Pawluk RJ, Pilla AA. Augmentation of Bone Repair by Inductively Coupled Electromagnetic Fields. Science. 1974;184(4136):575-577.
- Bawin SM, Adey WR. Sensitivity of calcium binding in cerebral tissue to weak environmental electric fields oscillating at low frequency. Proc Natl Acad Sci USA. 1976;73(6):1999-2003. (Landmark demonstration of amplitude and frequency windows.)
- Chen L, Duan X, Xing F, Liu G, Gong M, Li L, Chen R, Xiang Z. Effects of pulsed electromagnetic field therapy on pain, stiffness and physical function in patients with knee osteoarthritis: a systematic review and meta-analysis of randomized controlled trials. J Rehabil Med. 2019;51(11):821-827. doi:10.2340/16501977-2613.
- Dennis RG. Inductively Coupled Electrical Stimulation - Part 2: Optimization of Parameters for Orthopedic Injuries and Pain. Journal of Science and Medicine. 2020;1(2):27. (Single small-animal study; the bone slew-rate floor traces to this source.)
- Flatscher J, Pavez Lorie E, Mittermayr R, et al. Pulsed Electromagnetic Fields (PEMF) - Physiological Response and Its Potential in Trauma Treatment. International Journal of Molecular Sciences. 2023;24(14):11239. (A review noting that PEMF signal form is rarely reported, which is why induced field and slew cannot be pinned for soft-tissue and pain endpoints.)
- Goodwin TJ. Physiological and Molecular Genetic Effects of Time-Varying Electromagnetic Fields on Human Neuronal Cells. NASA Technical Publication NASA/TP-2003-212054. NASA Johnson Space Center; 2003.
- Hallett M. Transcranial Magnetic Stimulation: A Primer. Neuron. 2007;55(2):187-199.
- High slew rate pulsed electromagnetic field enhances bone consolidation and shortens daily treatment duration in distraction osteogenesis. Bone & Joint Research. 2021.
- ICNIRP. Guidelines for Limiting Exposure to Time-Varying Electric and Magnetic Fields (1 Hz to 100 kHz). Health Physics. 2010;99(6):818-836.
- Jerman I, Skafar M, Pihir J, Senica M. Evaluating PEMF vagus nerve stimulation through neck application: A randomized placebo study with volunteers. Electromagnetic Biology and Medicine. 2025;44(2):173-186. (Frequency-dependence context; a clinical-outcome study, cited only for the frequency comparison, not for efficacy.)
- Mansourian M, Shanei A. Evaluation of Pulsed Electromagnetic Field Effects: A Systematic Review and Meta-Analysis on Highlights of Two Decades of Research In Vitro Studies. BioMed Research International. 2021;2021:6647497.
- Markov MS. "Biological Windows": A Tribute to W. Ross Adey. The Environmentalist. 2005;25(2):67-74. doi:10.1007/s10669-005-4268-8.
- Masante B, et al. Insights into bone and cartilage responses to pulsed electromagnetic field stimulation: a review with quantitative comparisons. Frontiers in Bioengineering and Biotechnology. 2025;13:1557572. (Corroborates the ~0.08-0.1 G/us bone anchor; documents the FDA-cleared EBI/Bassett signal parameters.)
- Peripheral-nerve and cardiac stimulation thresholds (rheobase basis), as summarized in the induced-field safety literature.
- Physical Medicine Devices; Reclassification of Non-Invasive Bone Growth Stimulators. Federal Register (Aug. 17, 2020); documents PMA P790002 / Bio-Osteogen System 204 (1979) and the Class III to Class II reclassification.
- Standard EEG frequency-band nomenclature (Delta, Theta, Alpha, Beta, Gamma ranges).
- U.S. FDA Premarket Approval database, PMA P790002 (Stimulator, bone growth, non-invasive), approved November 6, 1979.
- Wagner T, Valero-Cabre A, Pascual-Leone A. Noninvasive Human Brain Stimulation. Annu Rev Biomed Eng. 2007;9:527-565.
- IEC 60601-1:2005+AMD1:2012+AMD2:2020 (Ed. 3.2), Clause 11: Protection against excessive temperatures and other hazards.
- IEC 60601-2-33. Medical electrical equipment - Part 2-33: Particular requirements for the basic safety and essential performance of magnetic resonance equipment for medical diagnosis (gradient dB/dt limits).
- On-axis field of a circular current loop (Biot-Savart law); any introductory electromagnetics text.
- SI unit definitions.
- Standard flux integration over area; any introductory electromagnetics text.
- Standard resistor-inductor (RL) circuit result; any introductory electromagnetics or circuits text.
The full measurement methods and references, including the physics and measurement conventions behind these results, are published at https://gausslabs.tech/references/.
Key Terms
Defined terms used elsewhere in this report.