
A smaller peak Gauss value can induce more in tissue. Faraday's law explains why.
Two PEMF devices sit side by side on a shelf. One brochure says 7,000 Gauss. The other says 1,500 Gauss. The bigger value looks like the obvious winner. Faraday's law explains why it sometimes isn't.
Tissue inside the body doesn't respond to the strength of a magnetic field. It responds to how fast that field is changing. A short, sharp pulse from a lower-peak device can induce more electrical activity in tissue than a tall, slow pulse from a higher-peak device.
Faraday's law: a changing field induces an electric field in tissue.
A changing magnetic field creates an electric field in any nearby conductor. The body is a nearby conductor. Cells, blood, and interstitial fluid all carry charge and behave electrically. As a PEMF pulse fires, the magnetic field rises and falls, and that changing field drives ions across cell membranes. That movement of ions starts the biological cascade PEMF therapy depends on.
The word that matters is "changing." A static magnet held against your wrist may feel reassuring, but nothing is moving, so nothing is induced. The field has to switch on, switch off, or sweep up and down. The faster the field changes, the stronger the induced electric field becomes. That is why PEMF works.
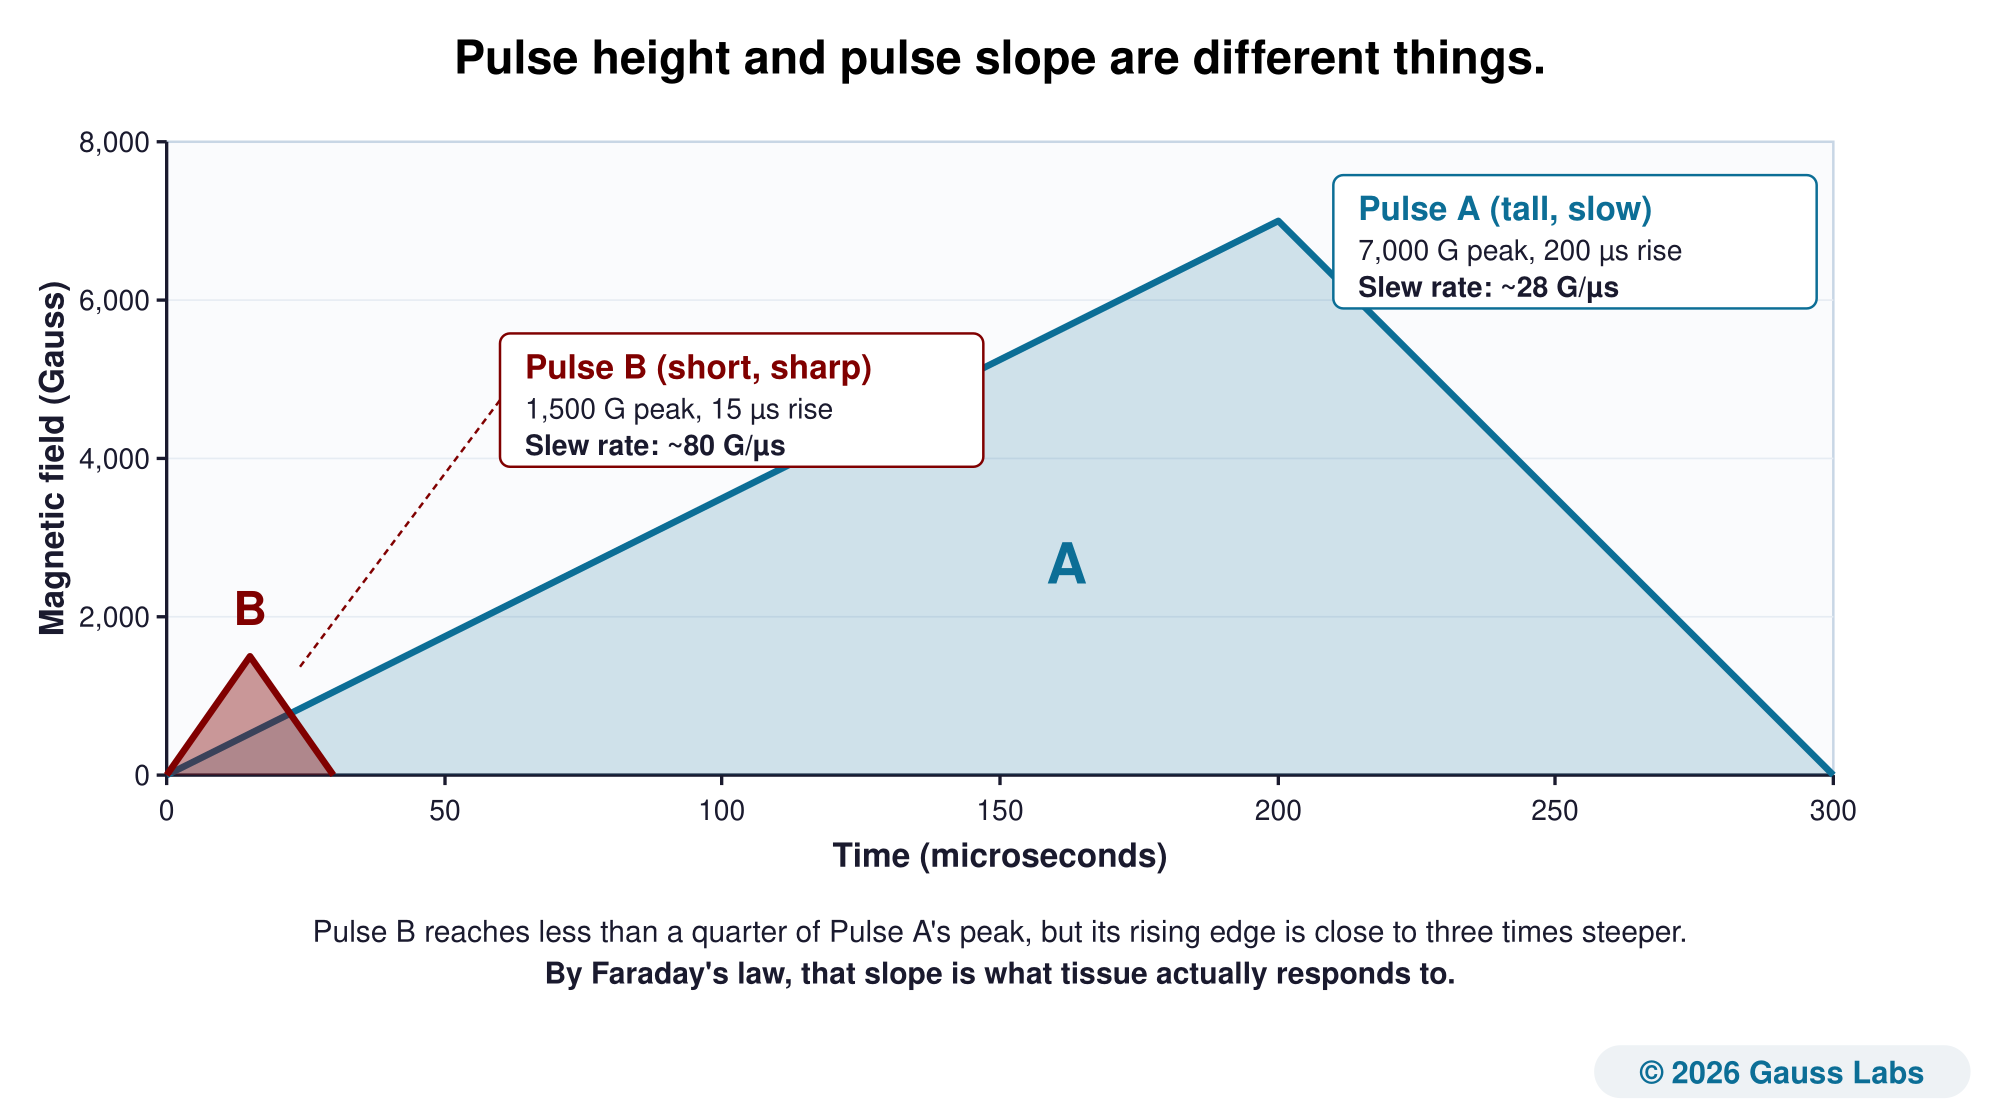
Engineers shorthand "how fast the magnetic field is changing" as dB/dt. The B is the magnetic field. The d/dt means "how much it changes per unit of time." dB/dt is the slope of the pulse's rising edge, expressed in Gauss per microsecond. A pulse that climbs to 7,000 Gauss over 200 microseconds has a slope of about 28 Gauss per microsecond. A pulse that climbs to 1,500 Gauss over 15 microseconds has a slope of about 80 Gauss per microsecond. The second pulse is shorter and weaker at the peak. It also changes about three times as fast. By Faraday's law, that second pulse induces roughly three times the electric field in tissue, even though its peak is less than a quarter the size of the first.
Peak Gauss measures strength. Slew rate measures the slope.
Peak Gauss is the highest the field reaches at any single location on the accessory surface. It measures strength. It doesn't say how fast the field got there, and the speed is what tissue responds to.
The metric that fills that gap is slew rate. Written in Gauss per microsecond, slew rate is the average rate of change across the rising edge of the pulse. It's the same physical quantity as dB/dt, presented as an engineering performance metric. A manufacturer that publishes slew rate is publishing the part of the pulse that determines how tissue responds.
Slew rate is the steepness of that rising edge. You read it off the captured pulse the way an oscilloscope does: take the field change between the 10 percent and 90 percent points, and divide it by the time the pulse spends getting from one to the other. The two pulses in the figure above show the arithmetic. Pulse A (7,000 Gauss, 200 microsecond rise) comes to about 28 Gauss per microsecond. Pulse B (1,500 Gauss, 15 microsecond rise) comes to about 80 Gauss per microsecond. Pulse A has more than four times Pulse B's peak. Pulse B has close to three times Pulse A's slope. These are two different design choices, both valid, and you can't tell them apart from peak Gauss alone.
Ask the manufacturer for slew rate or rise time.
A brochure that prints a peak Gauss value and nothing else leaves you guessing how well the device will perform. A brochure that prints peak Gauss alongside slew rate (or peak Gauss alongside rise time, which is the same information) gives you enough to compare two devices on what tissue actually responds to.
The next time you're comparing two PEMF devices, ask each manufacturer for the slew rate or rise time at the highest power setting. If both can answer with a specific value, you can rank them on Faraday's law instead of marketing math. If one or neither can, that's information too.
Our example reports show what a brochure can't.
Our published example reports capture the full oscilloscope waveform at every power setting and derive rise time, fall time, slew rate, peak dB/dt, and pulse balance from it. Every per-setting table lists those values next to peak Gauss, so you can see exactly how the slope changes as the device is dialed up or down. The public BBMPulser 5B device report, for example, records a measured slew rate of about 109 Gauss per microsecond at its top setting, paired with a measured peak field of roughly 22,000 Gauss. Once you've read a report like that, the empty space on a brochure is much easier to spot.
Check the slope, not just the peak.
Our example reports show what a fully tested pulse looks like, with rise time, fall time, and slew rate published at every setting. If you'd like to talk through what to look for on a specific device, we're happy to take the call.
Schedule a Call See Example ReportsPeak Gauss measures the field's strength. The slope determines what's induced in tissue. With both values published, a spec sheet finally tells you what Faraday's law would predict.