
Now you can see the field your device actually makes, in 3D.
Sign in to the Gauss Labs customer portal and you can now see the magnetic field your device produces as a 3D shape you can spin around, then watch it pulse on your device's own measured waveform. It isn't a stock illustration. It's the actual field we measured in our lab, rebuilt into a shape you can look at.
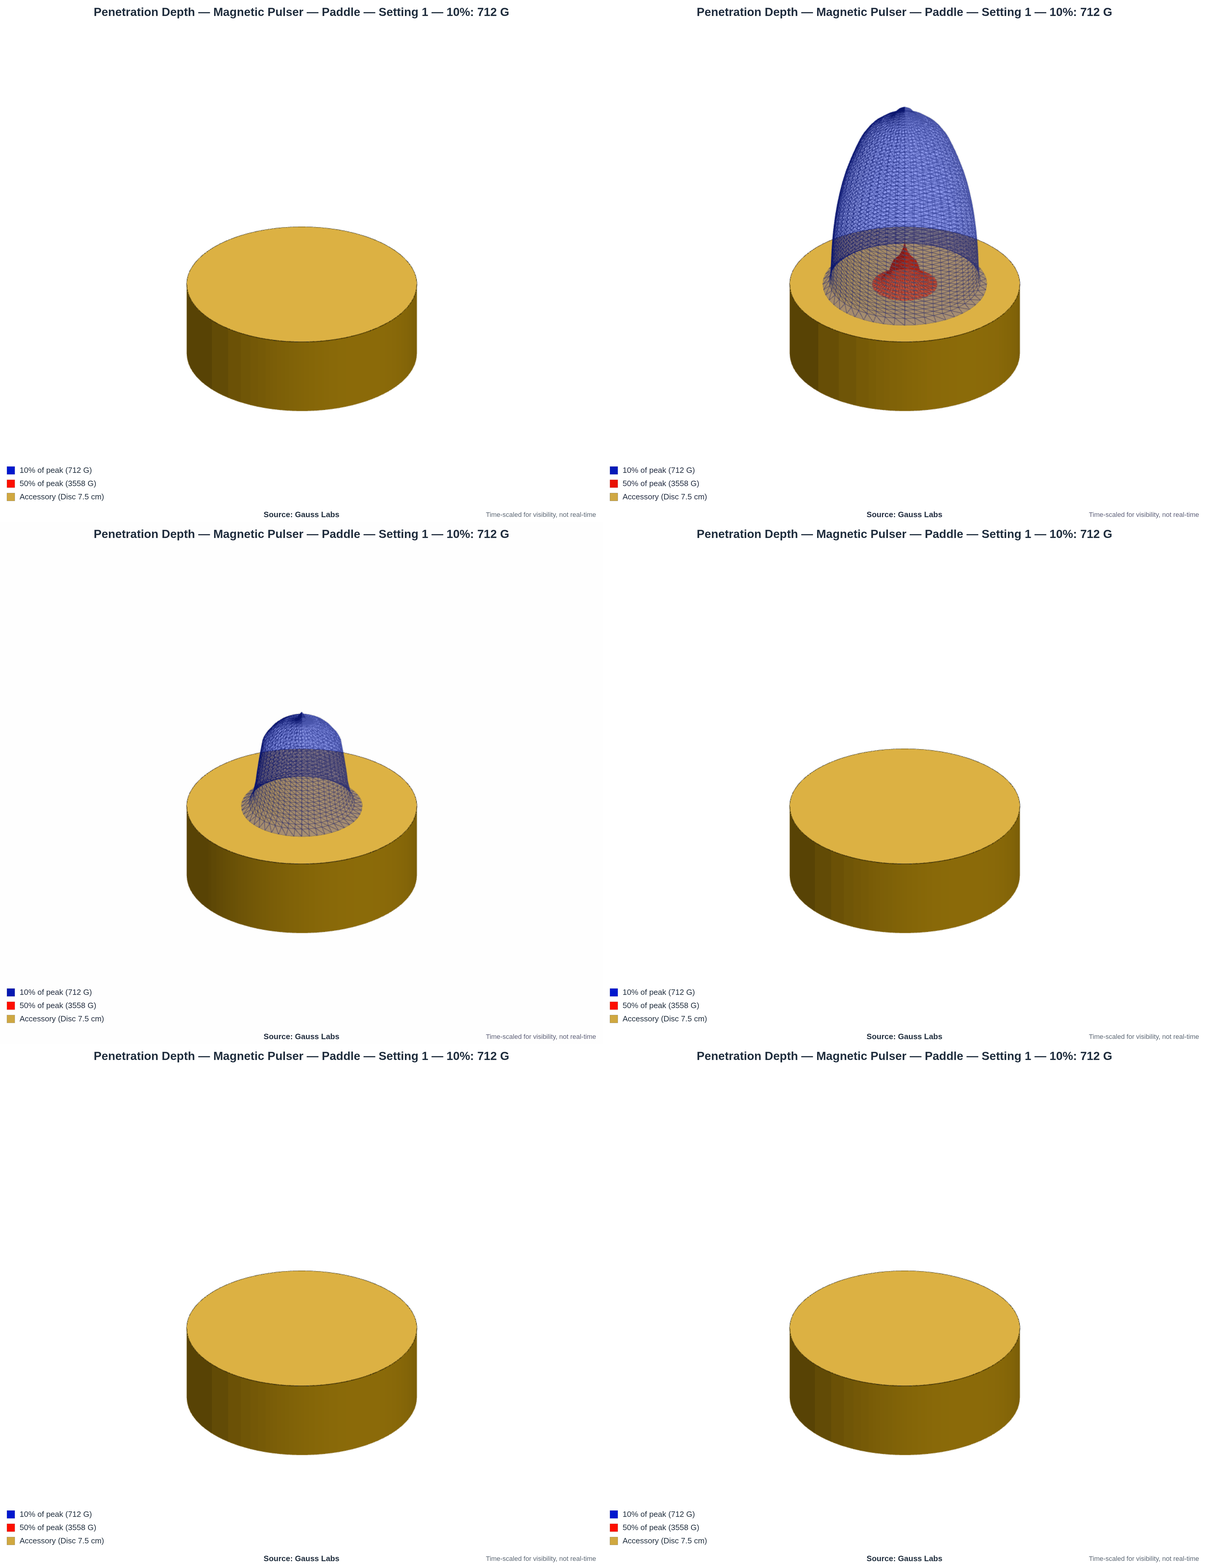
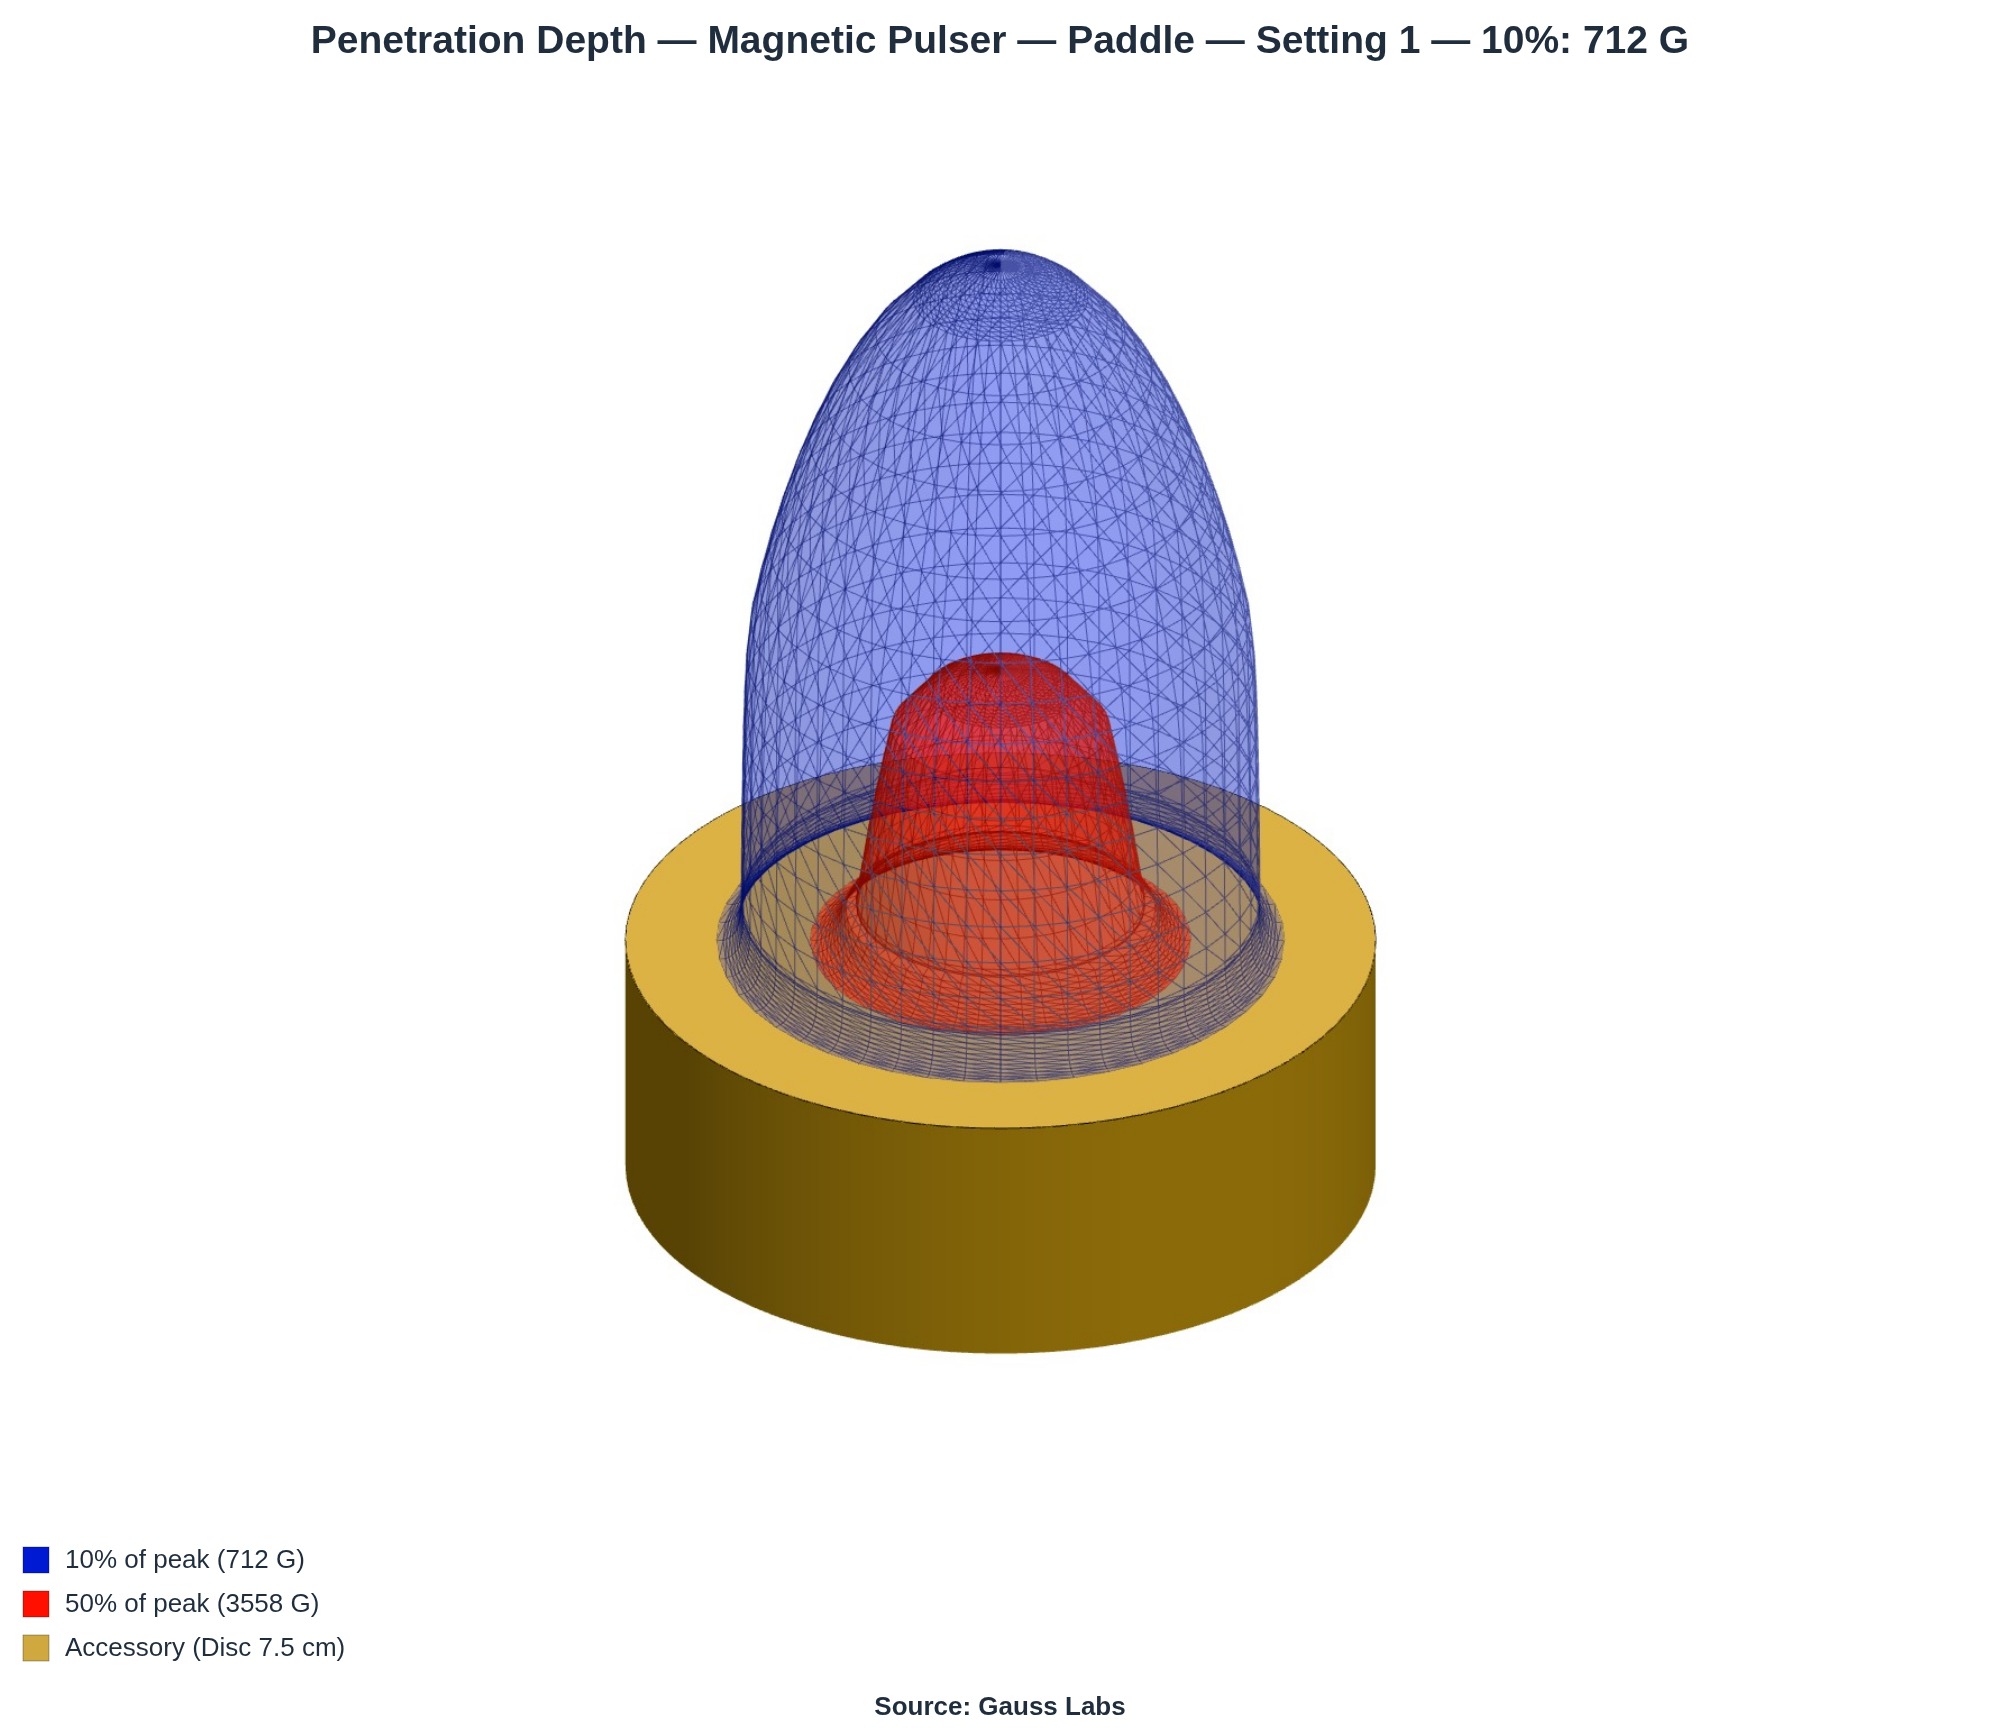
What you're looking at is measured, not illustrated.
This is the Magnetic Pulser with its Paddle accessory, built around a 7.5 cm (3 in) pancake coil. We bought this device to test it ourselves, and ran it the way we'd run any device you send us. Gauss Labs is the testing and certification division of Daboo Designs LLC, and we didn't make this one; we measured it. The gold disc is the accessory, drawn at its real size, and the colored shapes are the field above it.
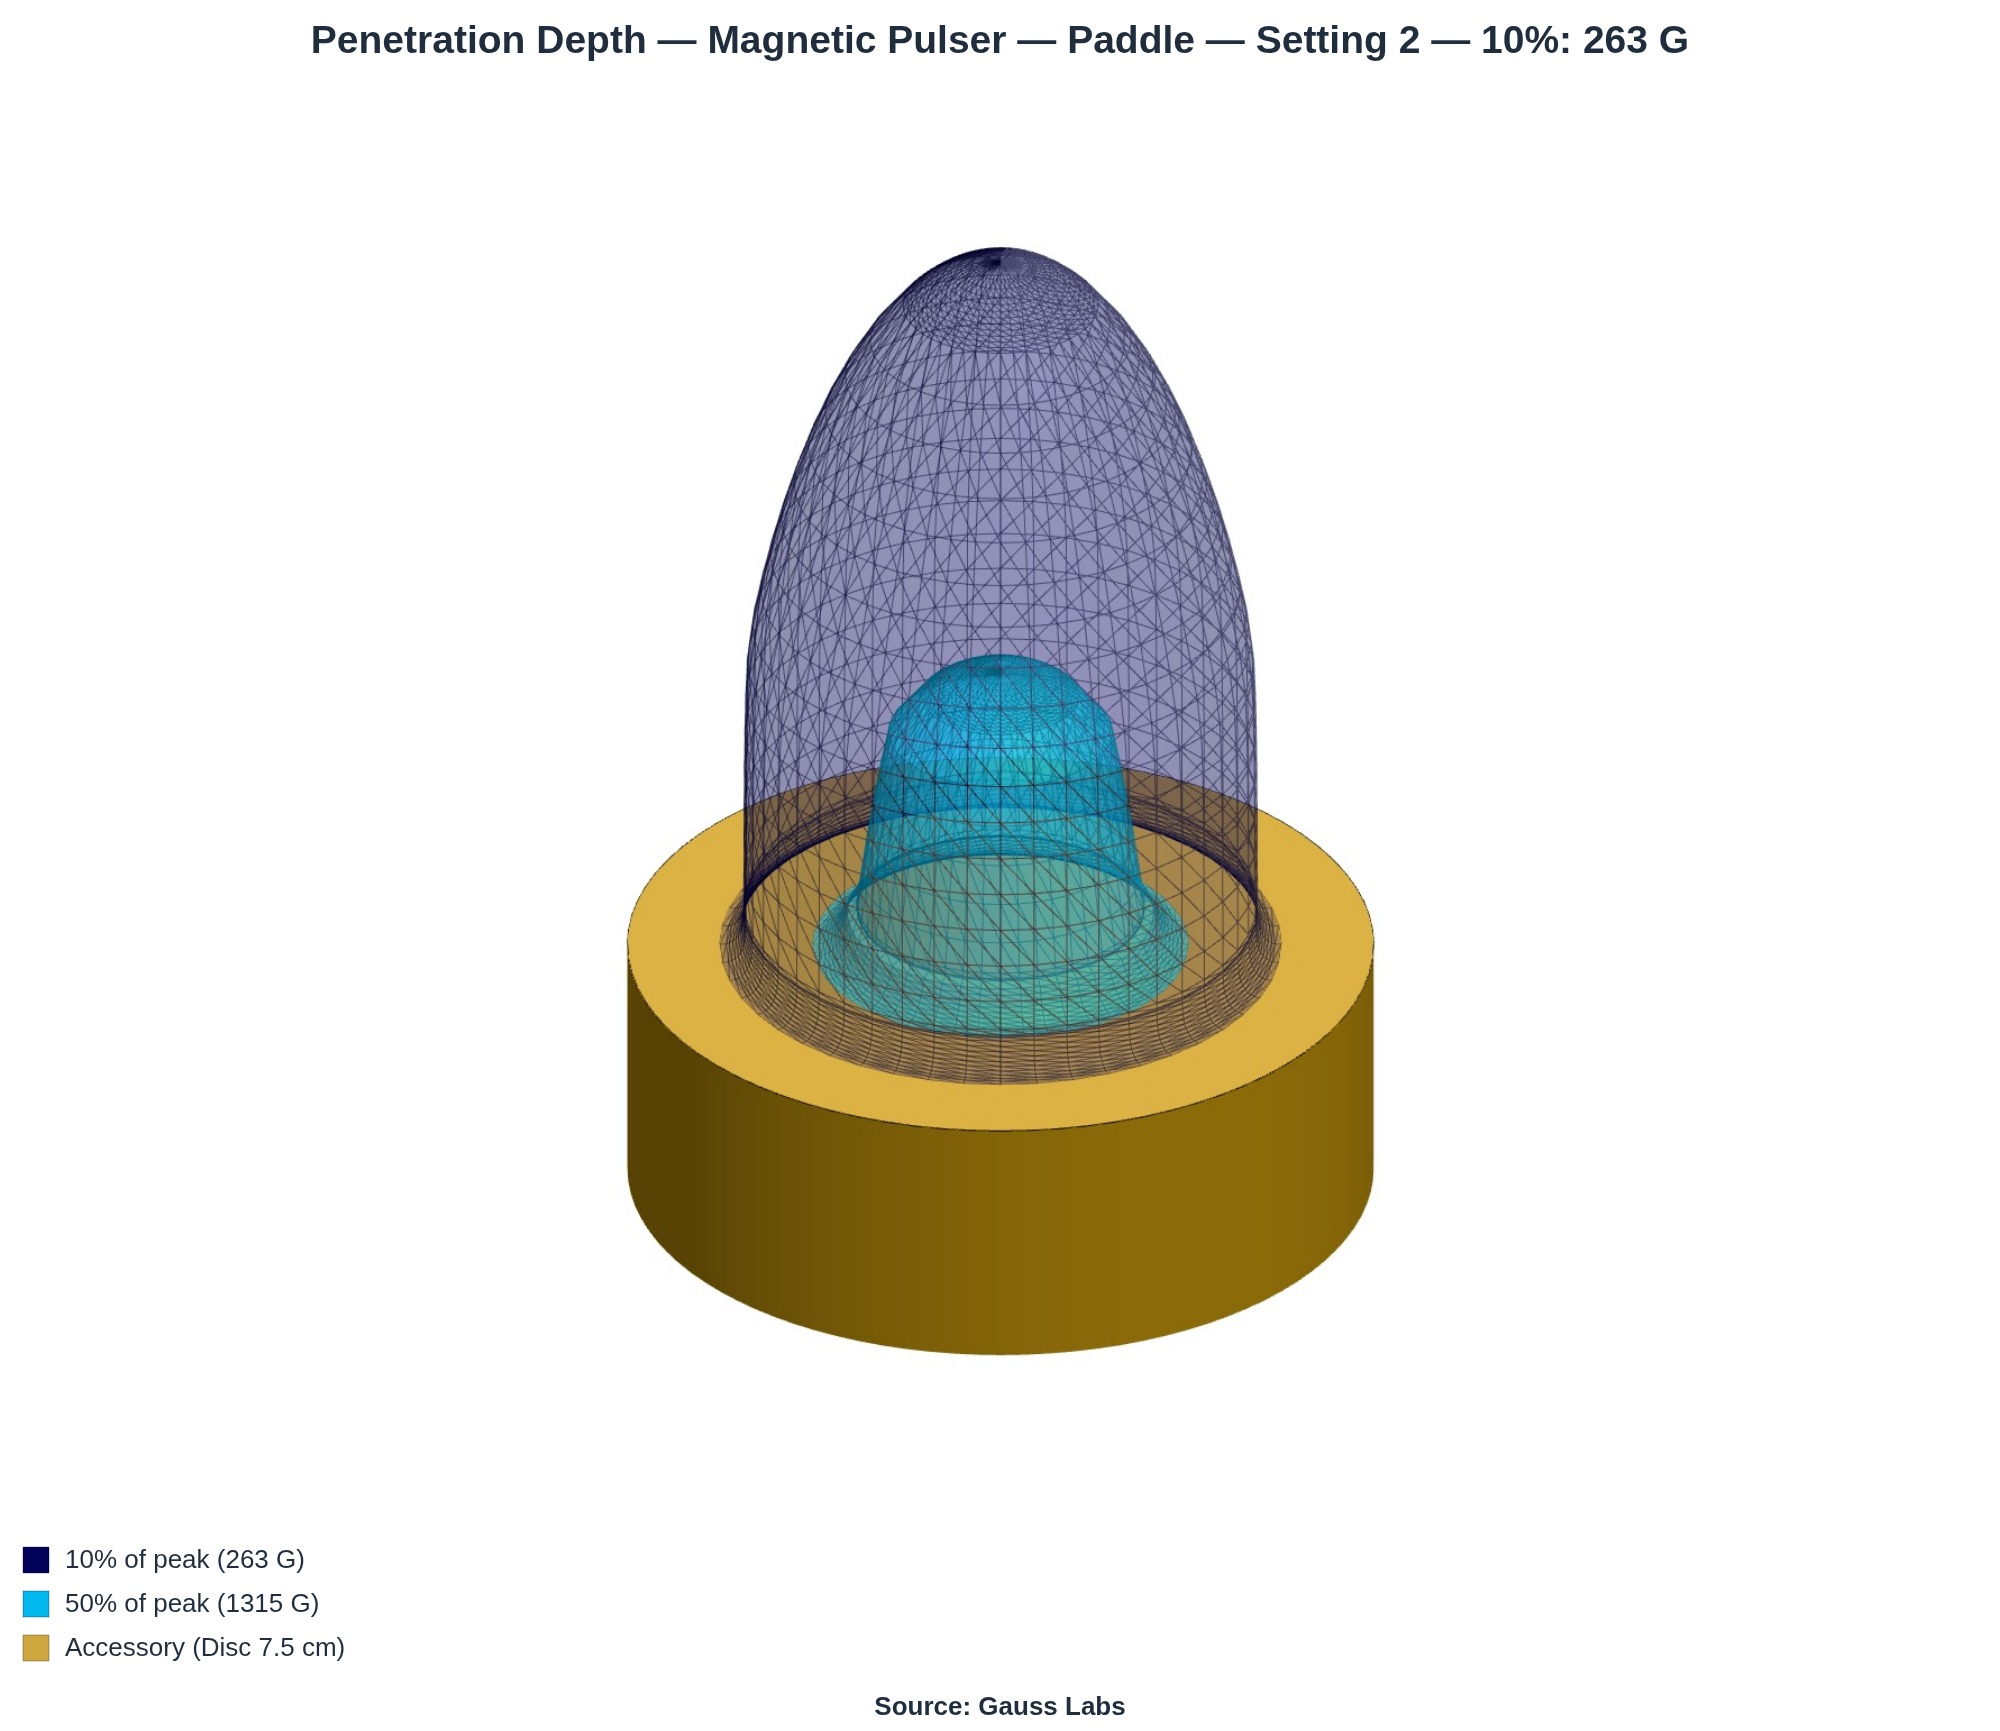
Each colored shell marks one strength level. The red shape is the volume where the field stays at or above half of the surface peak. The blue shape is where it stays at or above a tenth of it. Both shells are widest at the accessory surface and narrow higher up, because the field weakens with distance from the coil.
On this Paddle the field measures about 7,115 G at the surface, drops to roughly 2,600 G at 4 cm (1.6 in), and is down near 465 G by 8 cm (3 in). We measured those in our lab, in four directions out from the center, not pulled from a datasheet. The 3D shape is just those measurements made visible, the full field your device makes in open air. Tissue absorbs some of it, so this shape shows the field's maximum reach. Spin it, and the falloff you've only seen as a column of values becomes something you can point at.
It moves because your waveform moves.
Press play and the field swells and collapses. That motion isn't decoration. It follows the actual pulse shape we captured from the device, so a fast, sharp pulse looks fast and sharp, and a gentle one looks gentle. A different setting gives a different pulse, so it animates differently. You're watching your device's real rhythm, not a generic blink.
The shells grow and shrink with it, largest at the top of the pulse and pulling back toward the accessory as it falls. The animation rebuilds the field at every step, so each frame is the real field at that moment, just slowed enough to see.
The viewer is yours to explore.
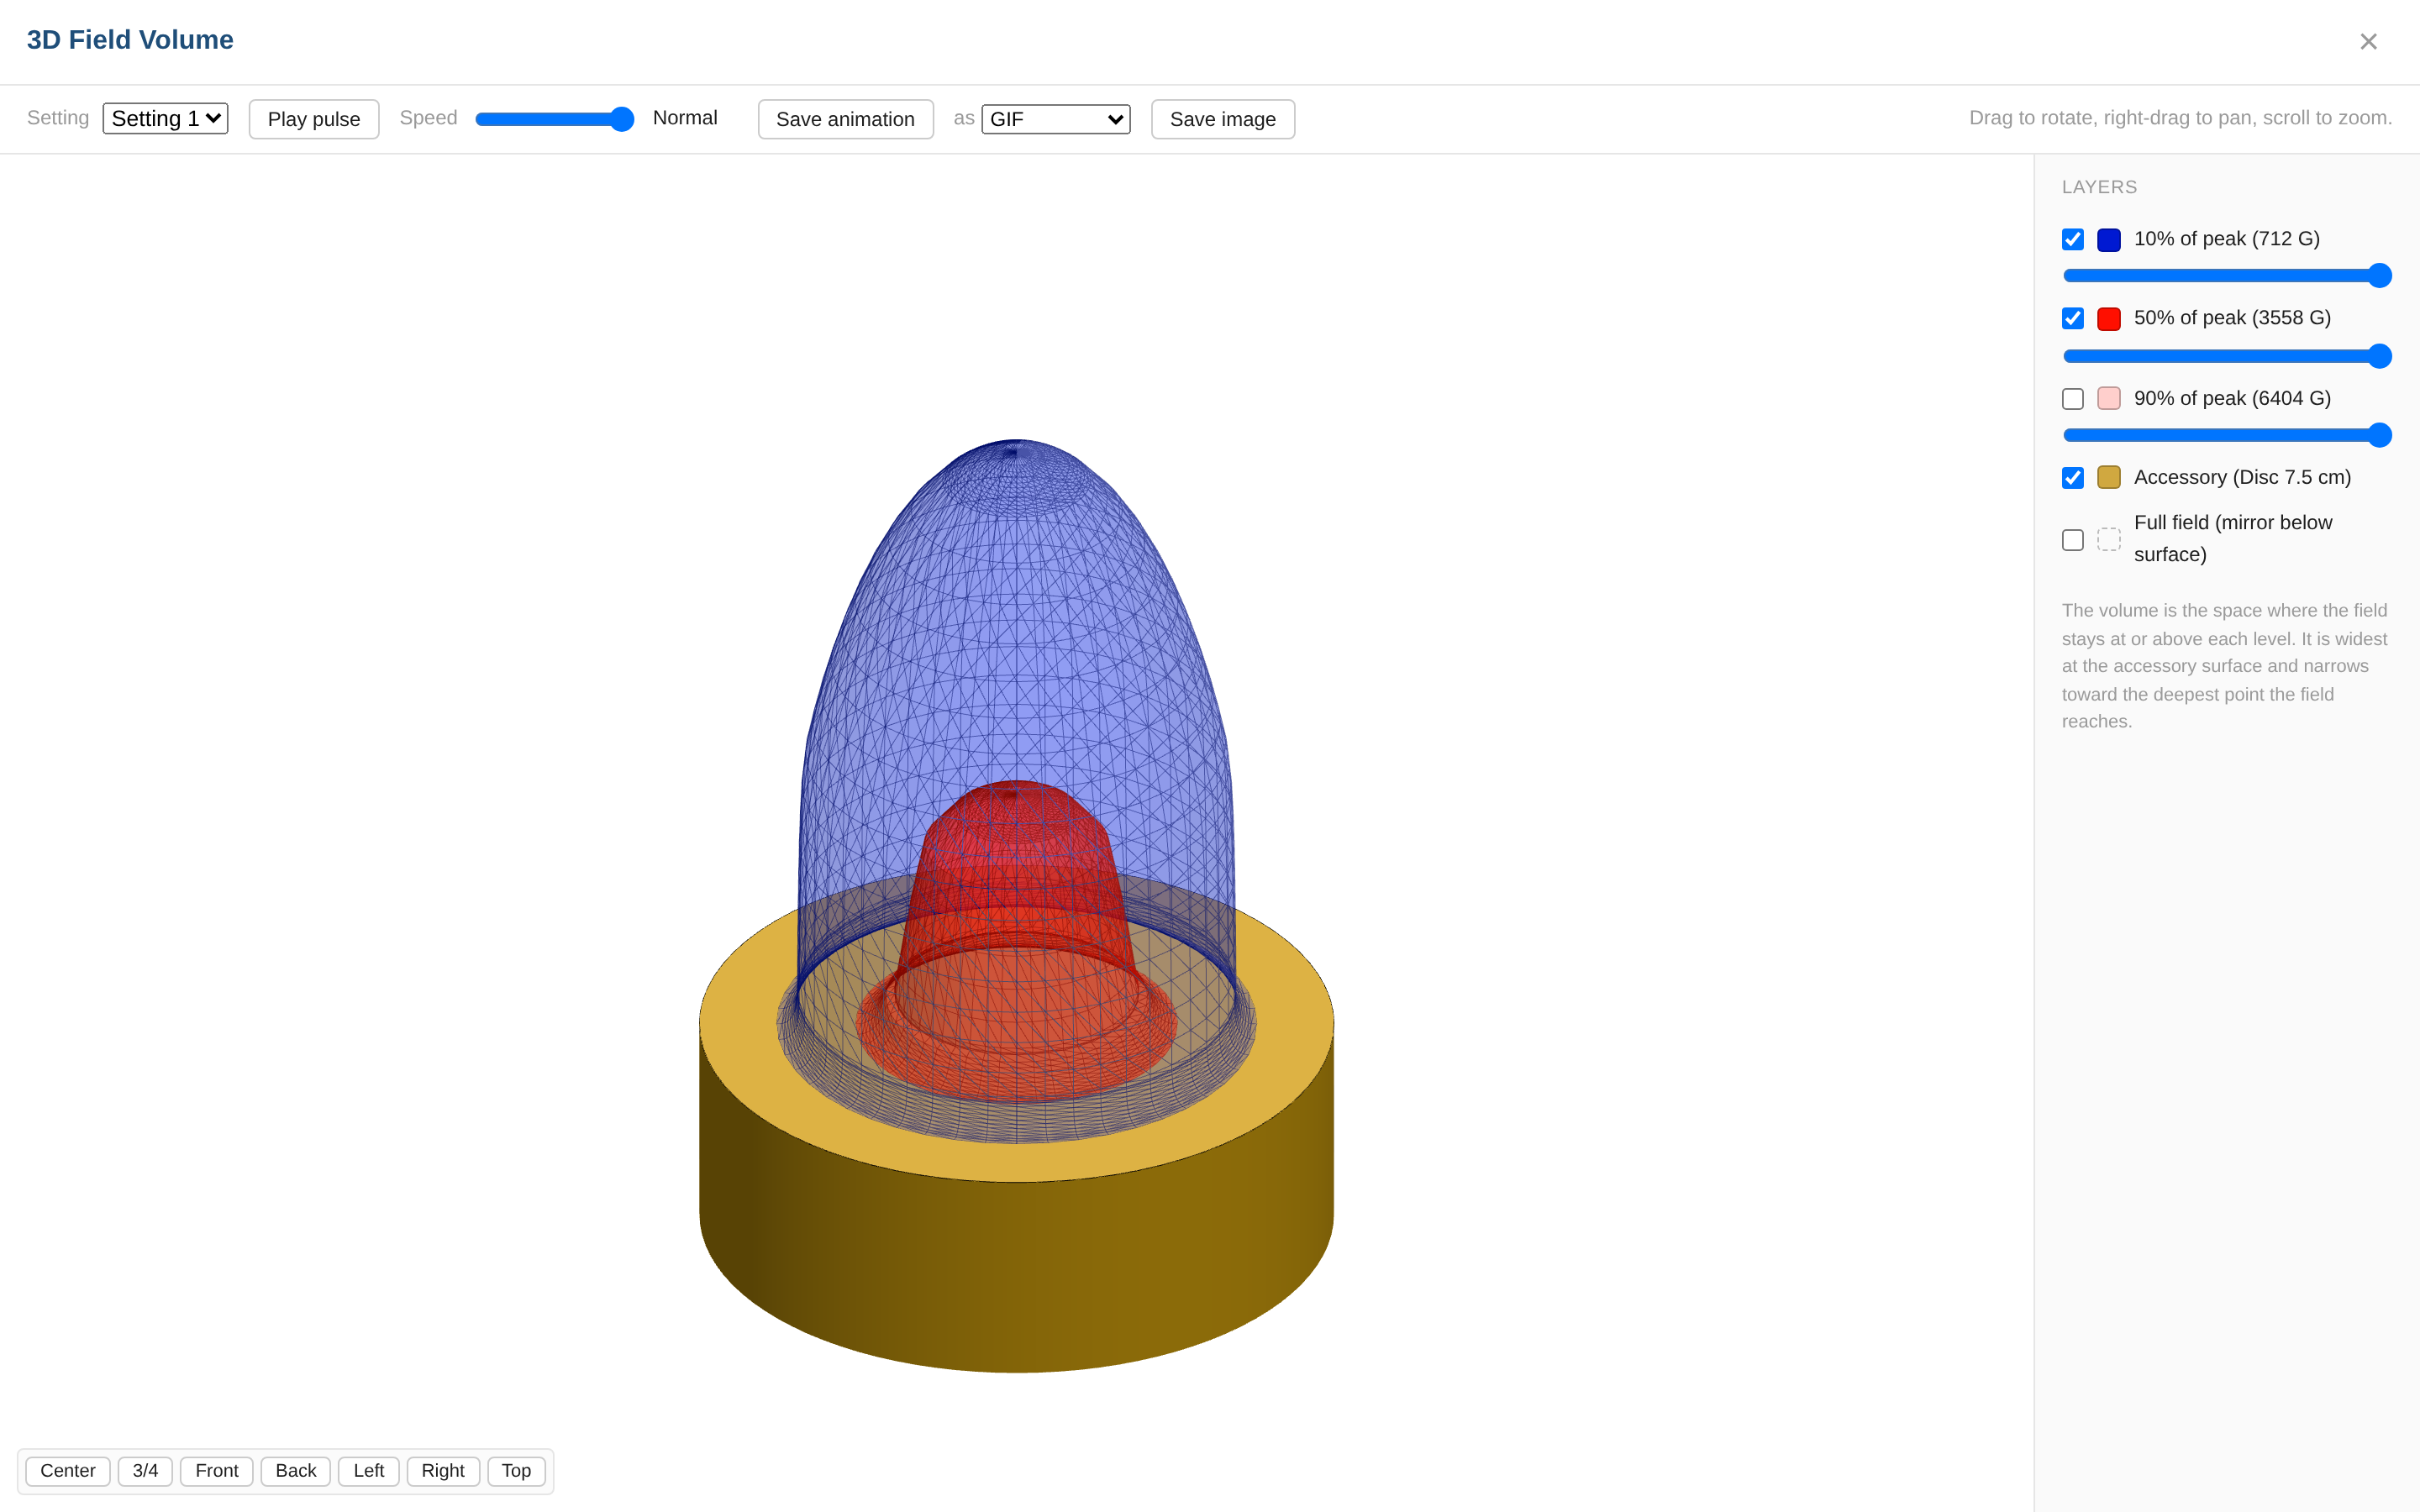
The viewer is interactive, not a fixed picture. You can:
- Drag to rotate, right-drag to pan, scroll to zoom.
- Turn each field shell on or off, and fade it with a slider, to see inside.
- Switch between your device's settings and compare them.
- Play the pulse, and slow it down with the speed control.
- Save a still image or the looping animation to share with your team.
The portal hands you everything from a test in one place.
The 3D field is the new headline, but it isn't the only thing waiting when you sign in. You also get:
- Your reports. Every finalized report as a PDF, and as a full HTML-and-images bundle you can open in a browser.
- Your certifications. Any published Gauss Labs certification for your device or accessory, ready to download and share.
- A side-by-side comparison. Your tests lined up across the measured values, so you can see which coil, loop, or mat performs best.
If we've tested your device, your portal is already waiting.
Signing in is a single link we email you. There's no password to set and none to lose. Ask for the link, click it, and you're in.
Not in our records yet? That's the easy part to fix. A test is where the 3D field, the reports, and a certification all begin, and your portal opens the moment we finish.
Want a portal of your own? It starts with a test.
Tell us about your device and we'll scope a certification, or see what a finished report looks like first.
Schedule a Call See Example ReportsThe portal turns a test into something you can open, spin, and share. Instead of reading about your device's field, you get to see it.