
Three readings at different heights show how fast a field fades. They don’t show how wide it is.
Some spec sheets list the field strength at three heights above the middle of an accessory, which is more than most sheets print. It’s still a narrow view, a bit like judging a hill from three spots on the path straight up the middle. To show what those readings tell you and what they miss, we’ll use a round accessory we tested in-house, with every number taken from its report.
What a falloff reading is.
“Falloff” means how quickly the magnetic field weakens as you move away from the accessory. To measure it, we hold a probe, the small sensor that reads the field, at set heights straight above the center. Each reading is in Gauss (G), a unit of magnetic field strength, and 1 kG is 1,000 G. The height is part of the reading, which is why it has its own name, the standoff distance. Here is one setting of the accessory we tested, a 7.5 cm (3 in) disc, read at five heights (report T2609191800, tested October 3, 2026).
| Height above the accessory | Field at the center | Share of the surface reading |
|---|---|---|
| 0 cm (the surface) | 6.49 kG | 100% |
| 1.2 cm (0.5 in) | 3.05 kG | about 47% |
| 3.6 cm (1.4 in) | 700 G | about 11% |
| 8.4 cm (3.3 in) | 97 G | about 1.5% |
| 18 cm (7.1 in) | 9.4 G | about 0.15% |
The field doesn’t fade in a straight line. It loses more than half of its strength in the first 1.2 cm, and then the loss slows down. Any three of those five readings would leave gaps. Take the surface, 3.6 cm and 18 cm: you’d know the start and the finish, and you’d have to guess how quickly it fell in between. We make the wider case for printing the numbers around a peak in our post on publishing your numbers.
The line between two readings is a guess.
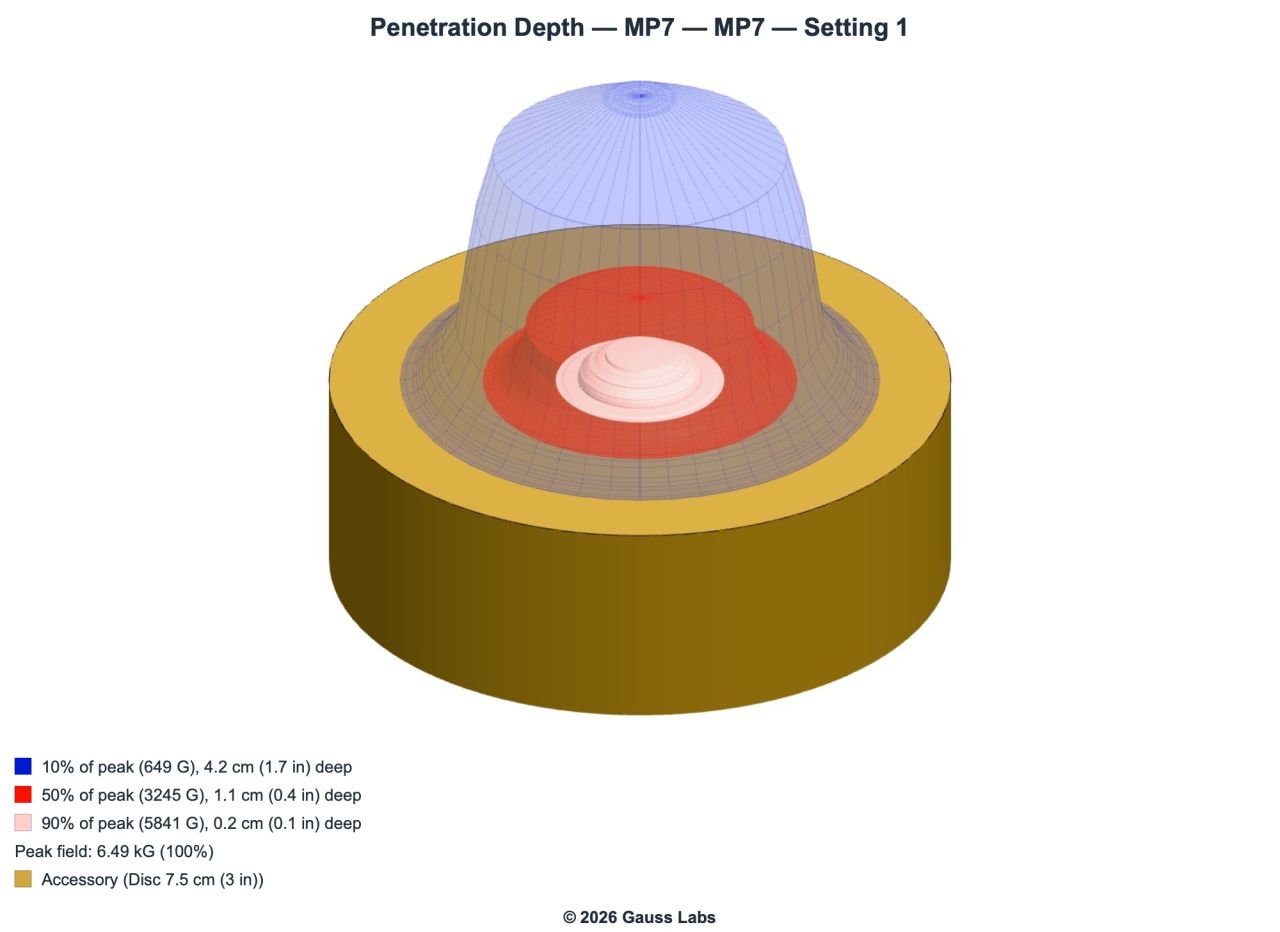
When a chart joins a few readings with a smooth line, the line is the author’s best guess at the path between them. That matters because the heights buyers ask about most, where the field has dropped to half of its peak and to a tenth, usually fall between two readings rather than on one. Our report marks them on a chart of the field standing over the accessory. The red shell is where the field has fallen to half of the peak, about 1.1 cm up, and the blue shell is where it has fallen to a tenth, about 4.2 cm up. Neither height was one of our readings, since we read at 0, 1.2, 3.6, 8.4 and 18 cm. Each mark falls between two readings, so its exact spot comes from a smooth line drawn between them.
The field also spreads sideways, which a line up the middle can’t show.
Every number in that table was read along one line, straight up from the center. The field around an accessory is spread across a whole surface, so we also read it out to the sides. On the same setting, at the surface and 2 cm out from the center, the four directions read like this.
| Direction from the center (2 cm out) | Field at the surface |
|---|---|
| Left (x-) | 2.37 kG |
| Right (x+) | 3.36 kG |
| Down (y-) | 3.49 kG |
| Up (y+) | 2.58 kG |
All four started from the same 6.49 kG at the center, and by 2 cm out they differ by more than 1 kG. A curve up the middle could never show that. If you only had the middle, you’d have to assume the field falls off the same way in every direction.
We put a number on that agreement with field symmetry, which for this setting is 92.4%. We also report how wide the field is. The effective field diameter, the span where the field stays above a tenth of its peak, is 56.9 mm for this accessory. We walked through that width, and the half-strength mark inside it, on a real accessory in our post on the two boundaries.
A fuller test reads more heights and more directions.
This test read the field on eight lines running out from the center, and it recorded 513 points in all, rather than the standard four lines. Each point is a real reading shown where it was taken, and nothing between the points is filled in. A test like that can show the shape of the field, and it lets us report the half-strength and one-tenth distances from readings rather than from a line someone drew. Each setting is read at five heights, so the curve up the middle gets five anchors instead of three.
These numbers describe the field, not your body. We measure in open air, and the 50% and 10% marks are reporting conventions rather than biological cutoffs. A wider or taller field is a different shape, which isn’t the same as a better one.
Ask how a falloff chart was made.
A falloff chart can be perfectly honest and still describe only the center line. These four questions show how much of the accessory it covers.
Four questions for any falloff chart.
- “At what height was each reading taken?” A reading taken closer to the accessory looks stronger for no other reason, so a missing height is worth asking about.
- “How many heights were read?” Three readings leave gaps, and five show where the field fades quickly and where it slows down.
- “Was it read along one line, or in several directions?” A curve up the middle can look perfectly even on an accessory whose sides aren’t.
- “Were the half and one-tenth distances measured?” Ask whether they come from readings or from a line someone drew between points.
Want your falloff measured at five heights and in every direction?
We read every accessory at several heights and out along lines from the center, and we report the falloff distances and the symmetry score alongside the peak. If you’d like to see the measurement work first, our example reports are open to read.
Schedule a CallSee Example ReportsA few readings up the middle tell you how quickly the field fades. Readings at more heights and in more directions tell you how far it reaches and whether it reaches evenly, so ask for both.