
A published slew rate can't be compared until you know four things about how it was measured.
PEMF spec sheets have started carrying a slew rate, usually written in tesla per second. Slew rate is how fast the magnetic field climbs during each pulse. That's worth knowing, because a field that changes quickly induces a stronger current in tissue than a field that changes slowly. The value is being published the way peak Gauss always was, though: one value, and nothing about how it was measured. Here's what a seller should provide regarding slew rate so you can compare two devices.
Tesla per second makes the same speed look much bigger.
That speed gets written two ways that look nothing alike. We report slew rate in Gauss per microsecond, written G/µs, while others in the market use tesla per second, written T/s. Both units measure the same thing, and 1 G/µs is 100 T/s, so the figure written in T/s is always the bigger-looking one. Our reports give the T/s value in parentheses, so nobody has to do the conversion. If two spec sheets use different units, convert one of them before you compare the two.
One coil we tested spans 48.7 to 109.3 Gauss per microsecond.
We bought a BBMPulser 5B for in-house testing and measured it driving its Classic 3-inch (76mm) strip coil. That's a narrow accessory, and its usable field spans 60mm (2.4 in). It runs a sawtooth pulse, which climbs fast and falls slowly. Same device, same accessory, same waveform, nine power settings, nine different slew rates.
At the lowest setting the field reaches 10,450 Gauss and the edge climbs at 48.7 G/µs, which is 4,870 T/s. At the highest it reaches 22,410 Gauss and climbs at 109.3 G/µs, or 10,930 T/s. Every pulse takes about the same time to climb, 140 to 160 microseconds, and that span is the rise time. So at the top setting the field covers more than twice the distance in about the same time, and that's what makes the edge steeper.
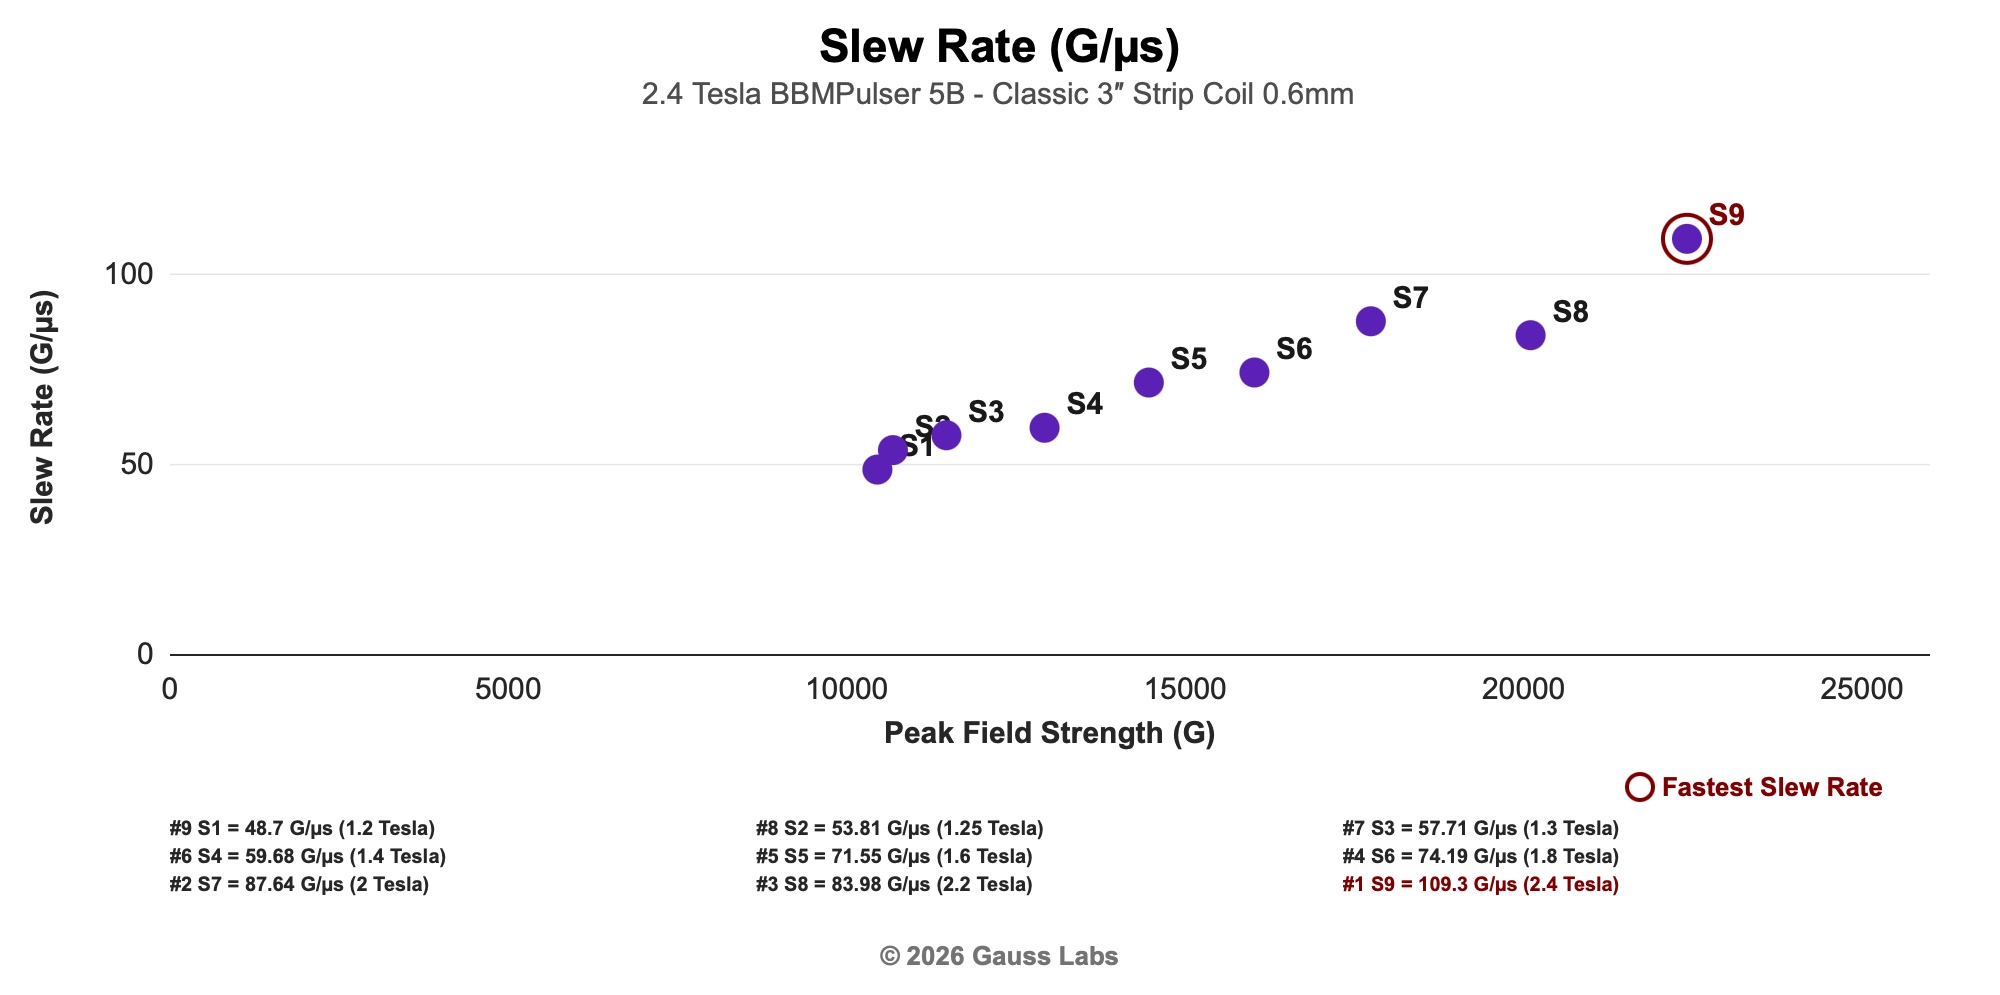
Both values are true of the same accessory. A seller quoting either one has published a real value, and a buyer reading only that value can't tell which end of the dial it came from. The dial doesn't climb evenly either: setting 8 reads 84.0 G/µs, slower than setting 7 at 87.6, so you can't work out the middle of the range from the two ends of it. That's why we publish every setting rather than the best one.
Move the probe and the same pulse reads lower.
We read a slew rate off the field at one spot on the accessory, so the value carries the field strength at that spot. Move the probe off the strongest point, or lift it 10mm (0.4 in) off the surface, and the same pulse reads lower.
So we put the probe on a jig, hold the standoff distance constant, and state the field level the slew rate was read at. Our post on scanning an accessory on four axes covers how we hold that gap steady. A slew rate published with no position and no standoff is a value you can't check, even against another product from the same seller.
The value depends on which two points you read between.
Even with the setting and the probe position pinned down, a slew rate still depends on where you start and stop reading the climb.
We read it as the average slope between two points: where the field crosses 10 percent of its peak, and where it crosses 90 percent. That's how an oscilloscope reads any rising edge, and it's the convention our reports state. The climb isn't equally steep the whole way up, so a different pair of points gives a different value off the same pulse.
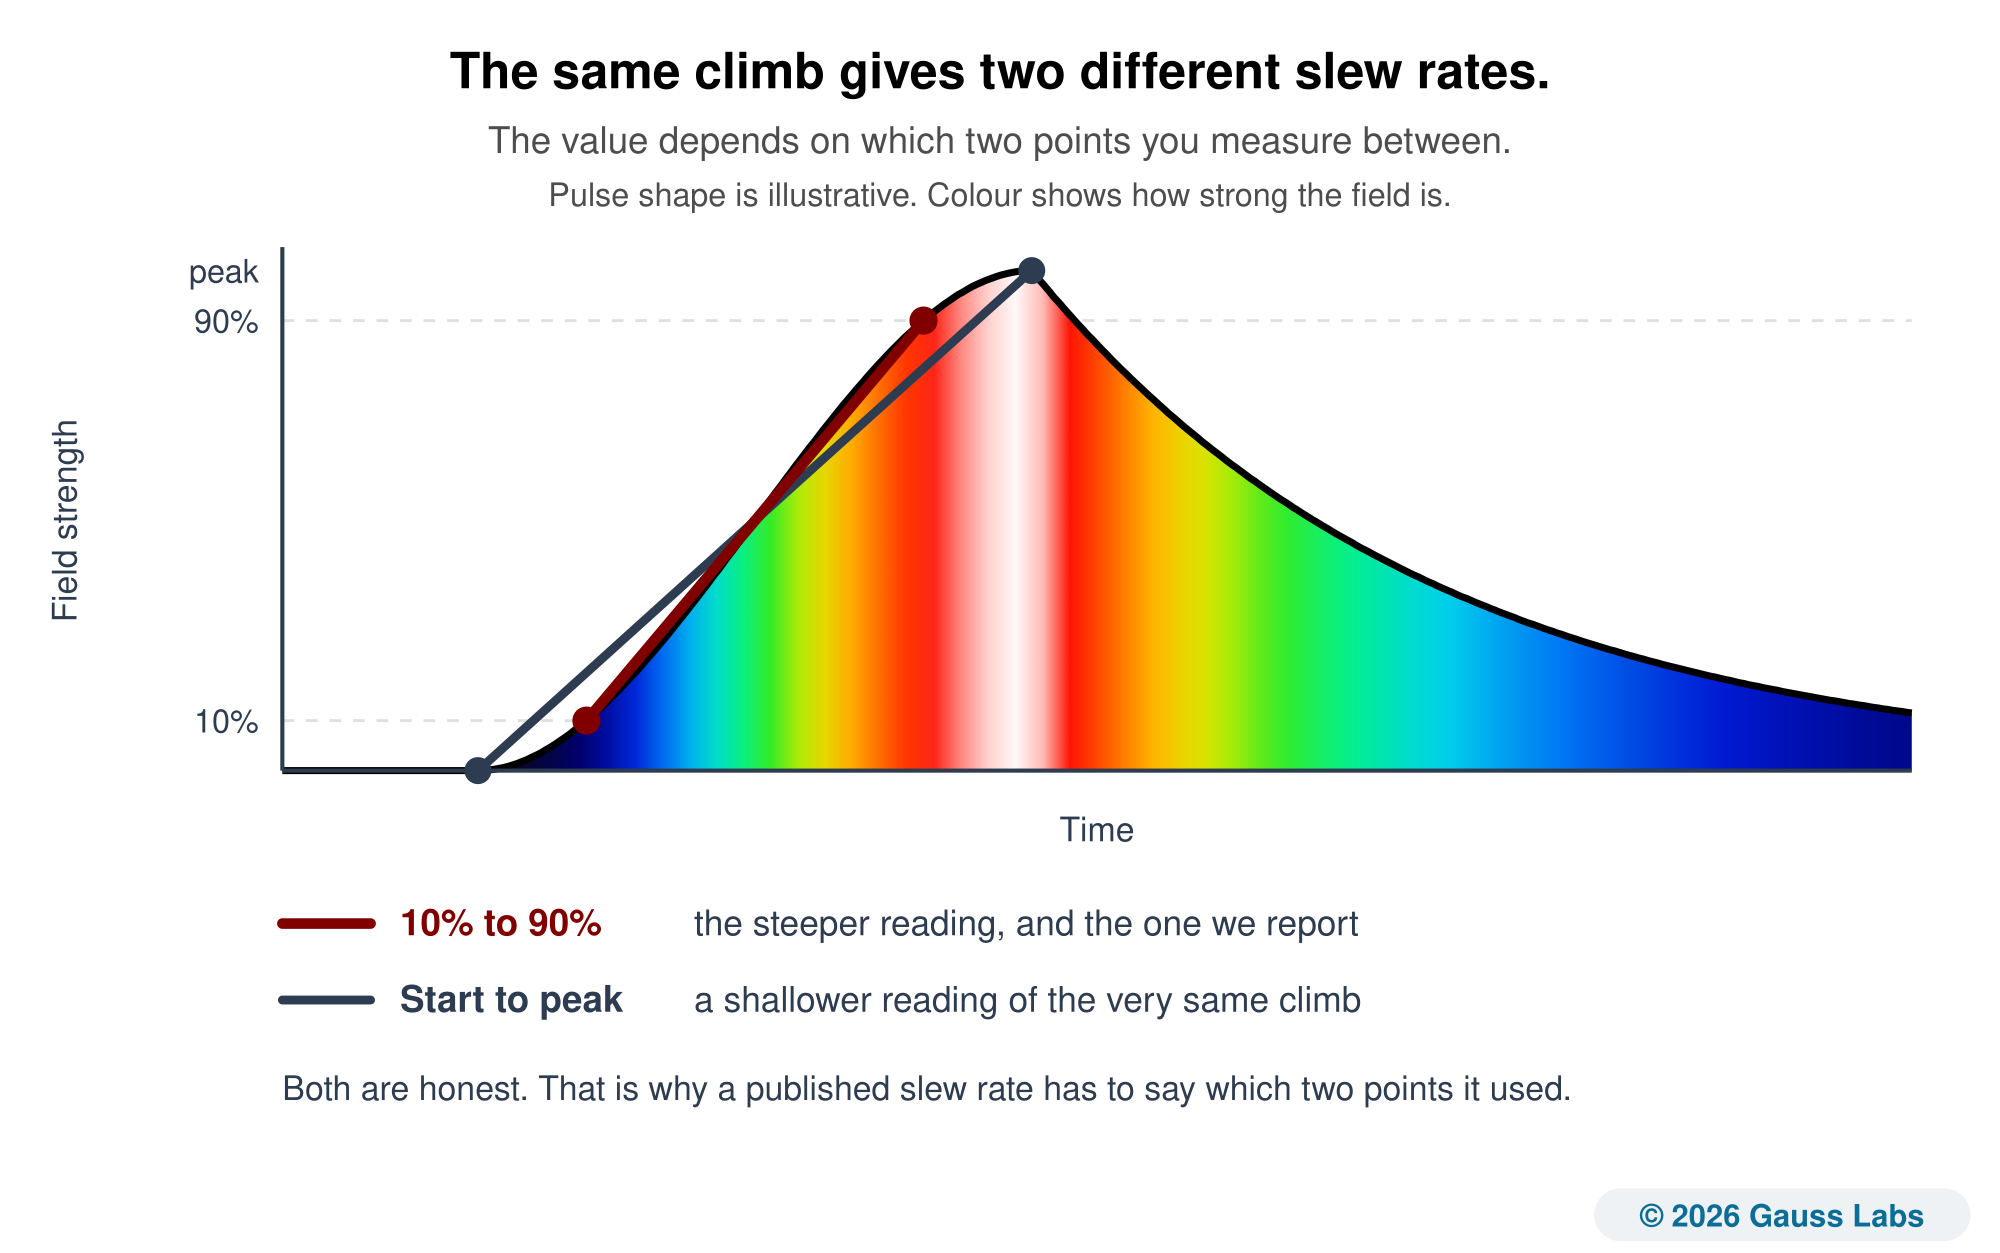
We know how much that choice matters, because changing ours moved every value we publish. In June 2026 we started reading the real 10 and 90 percent crossings off the captured waveform. Every slew value in every report shifted. No arithmetic turns an old one into a new one, so we measured them all again.
A figure with no captured pulse behind it can't be checked.
The first three facts all come off one thing. We capture each setting's pulse on an oscilloscope, which draws it as a trace, a picture of how the field rose and fell. We read the rise, the fall and the edge speed off that trace. The report then publishes the trace, not just the values it produced. That's what lets you check a slew rate instead of taking the seller's word, and it's the part a spec sheet almost never carries.
The trace also shows you the waveform type, which is the shape of the pulse. You need that for the same reason. A sawtooth, a square and a sine all climb differently, so the shape is part of what the slew rate describes.
We mark the fastest setting we measured, not a target to aim for.
Buyer's guides have started naming a best slew-rate window, or a minimum value for one use and a lower one for another. Those windows trace back to marketing pages rather than to published research, and the tables that set a slew-rate floor by condition have no peer-reviewed basis behind them. So we mark no range as the optimal one.
What we do mark is the fastest setting on the pairing we tested. The slew rate chart in the report flags it, so you can see which position on the dial produces the steepest edge on that device with that accessory. That's a fact about the hardware in front of you, not advice on where to run it.
One more claim travels with this metric, and it's worth naming. A faster-changing field does induce a stronger stimulus, and that part is real physics. It does not reach deeper into the body. At the low frequencies a PEMF device uses, tissue is nearly transparent to a magnetic field. How far the field carries is set by its strength and the coil geometry, not by the speed of the edge. A sharper pulse and a longer reach are two different specs, the same way a higher Gauss value and a sharper pulse are.
Ask four things about any slew rate you're shown.
- Ask which setting it came from. A device with a dial has a slew rate at every position on it. On the coil above, the top setting read more than double the bottom one.
- Ask where on the accessory it was measured, and how far off the surface. The value carries the field strength at that spot. Without a position and a standoff distance, there's nothing to check it against.
- Ask which two points on the edge define it. We read between the 10 and 90 percent crossings. A different pair gives a different value, so a good report states the convention it used.
- Ask to see the captured pulse. The waveform is where the value came from, so a seller who has one can show it.
Those four answers won't rank the two devices for you. They make the two values mean the same thing, so a gap between them is a real difference in the hardware rather than a difference in how each seller measured. You can't get that from the value on its own, and it has to come first.
None of this makes a published slew rate dishonest. A seller quoting one is ahead of a seller quoting nothing, and the metric is worth the attention it's getting. Work out which kind of accessory you need first, then read the pulse timing specs on the two or three that fit.
Want your device's slew rate measured and published in full?
We capture the pulse at every setting, read the edge off the trace, and report the value with the setting, the position and the waveform it was measured under. If you'd like to see what that looks like, our example reports are open to read.
Schedule a Call See Example ReportsOn its own, a slew rate is a value you can't check. The setting, the probe position, the two points on the edge and the captured pulse are what let you compare one device with another.