Your peak Gauss value is accurate, but that's only a small part of a bigger picture.
When your buyer reads the peak Gauss value on your spec sheet, they imagine that's for the entire surface of the accessory. They don't know that it's measured at one point, at one setting, directly on the accessory surface. Additional measurements let you show more of the accessory's characteristics in your documentation.
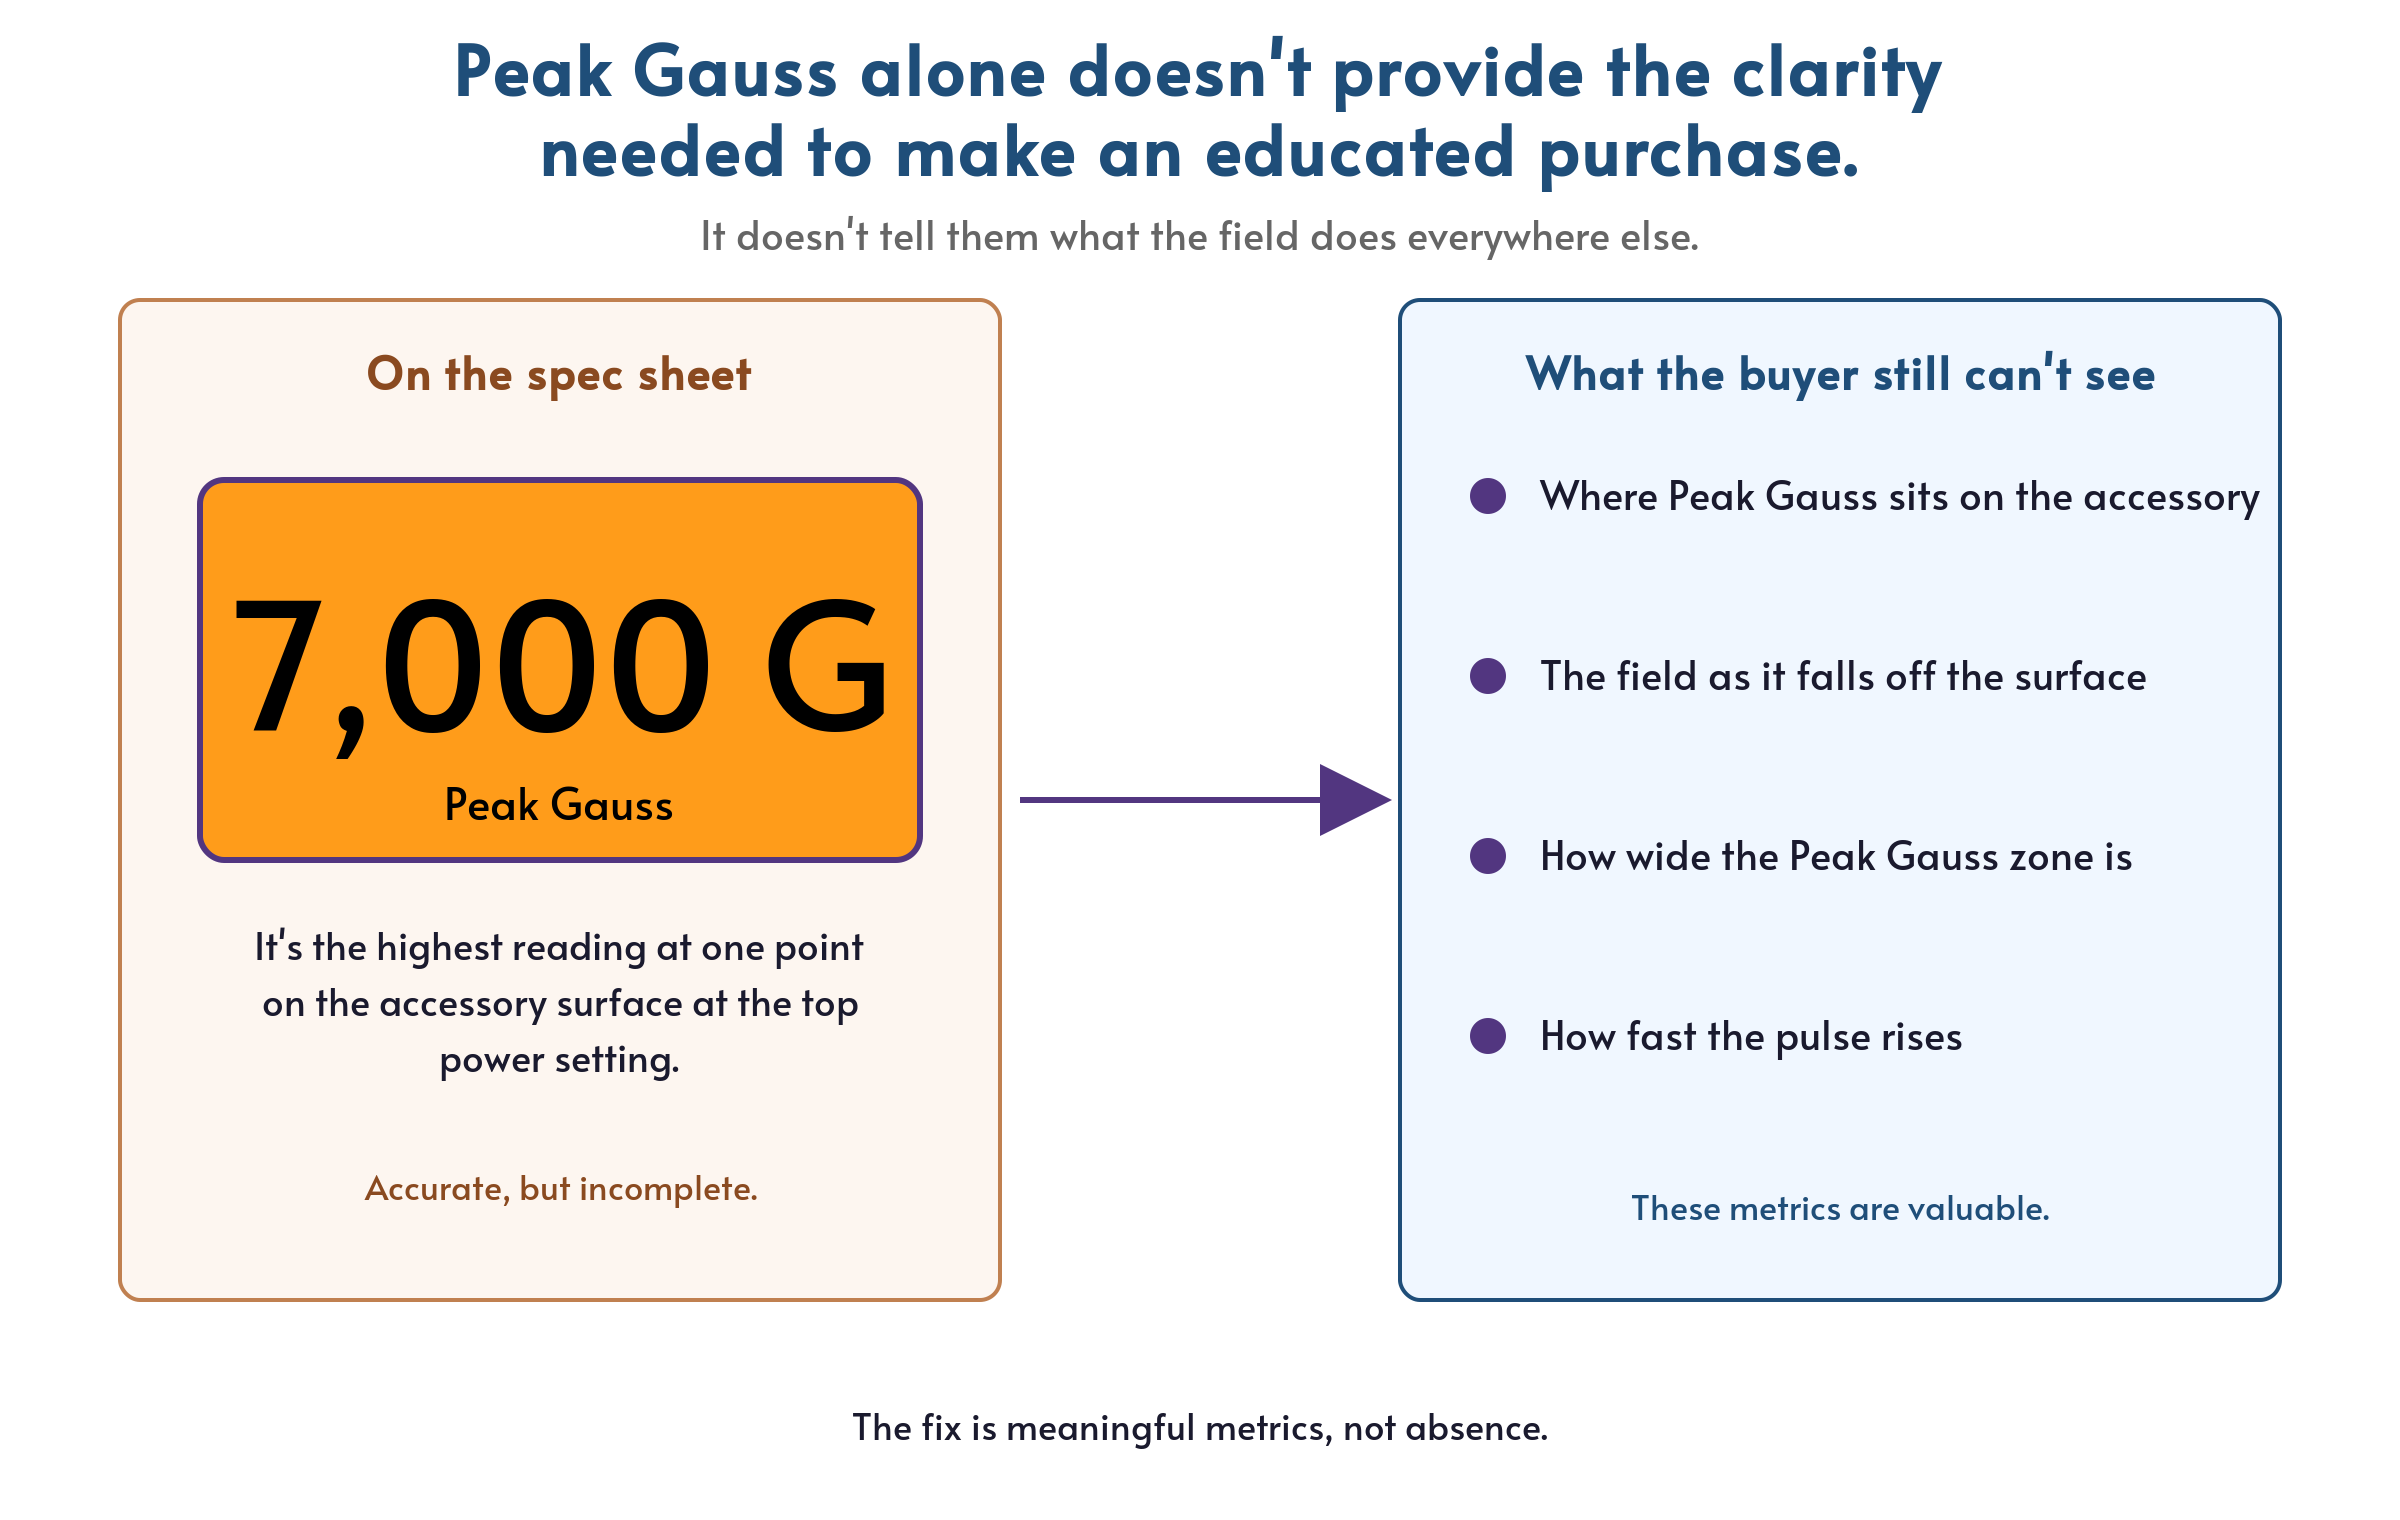
Peak Gauss is one point, but your buyer reads it as the whole field.
Peak Gauss is the highest field strength your accessory produces, measured directly on its surface. Where that peak sits depends on the coil construction inside the housing: a pancake coil peaks at the center of the disc, a donut coil peaks in a ring near the windings, a loop peaks along the wire. The published peak almost always comes from the top power setting, taken with the Gauss meter probe against the accessory's surface and dialed in for the highest reading (not interpolated). Move the probe a few millimeters off the surface and the field drops. Drop the setting and it drops again.
Your buyer doesn't know any of that. When they read "peak field" on a spec sheet, they assume the value describes the whole accessory, not one strong point on it. After a session, if the outcome falls short of what the brochure suggested, they land on one of two conclusions: the manufacturer overstated what the equipment does, or they misunderstood how to use it. Either way, you've lost the next sale. Follow-up questions arrive a week after delivery. A return request lands three weeks in. New business drifts toward competitors with bigger numbers, whether those numbers are bench-tested or just claimed. The next sale isn't lost on accuracy. It's lost on what the buyer never saw.
A more elaborate test shows what the peak leaves out.
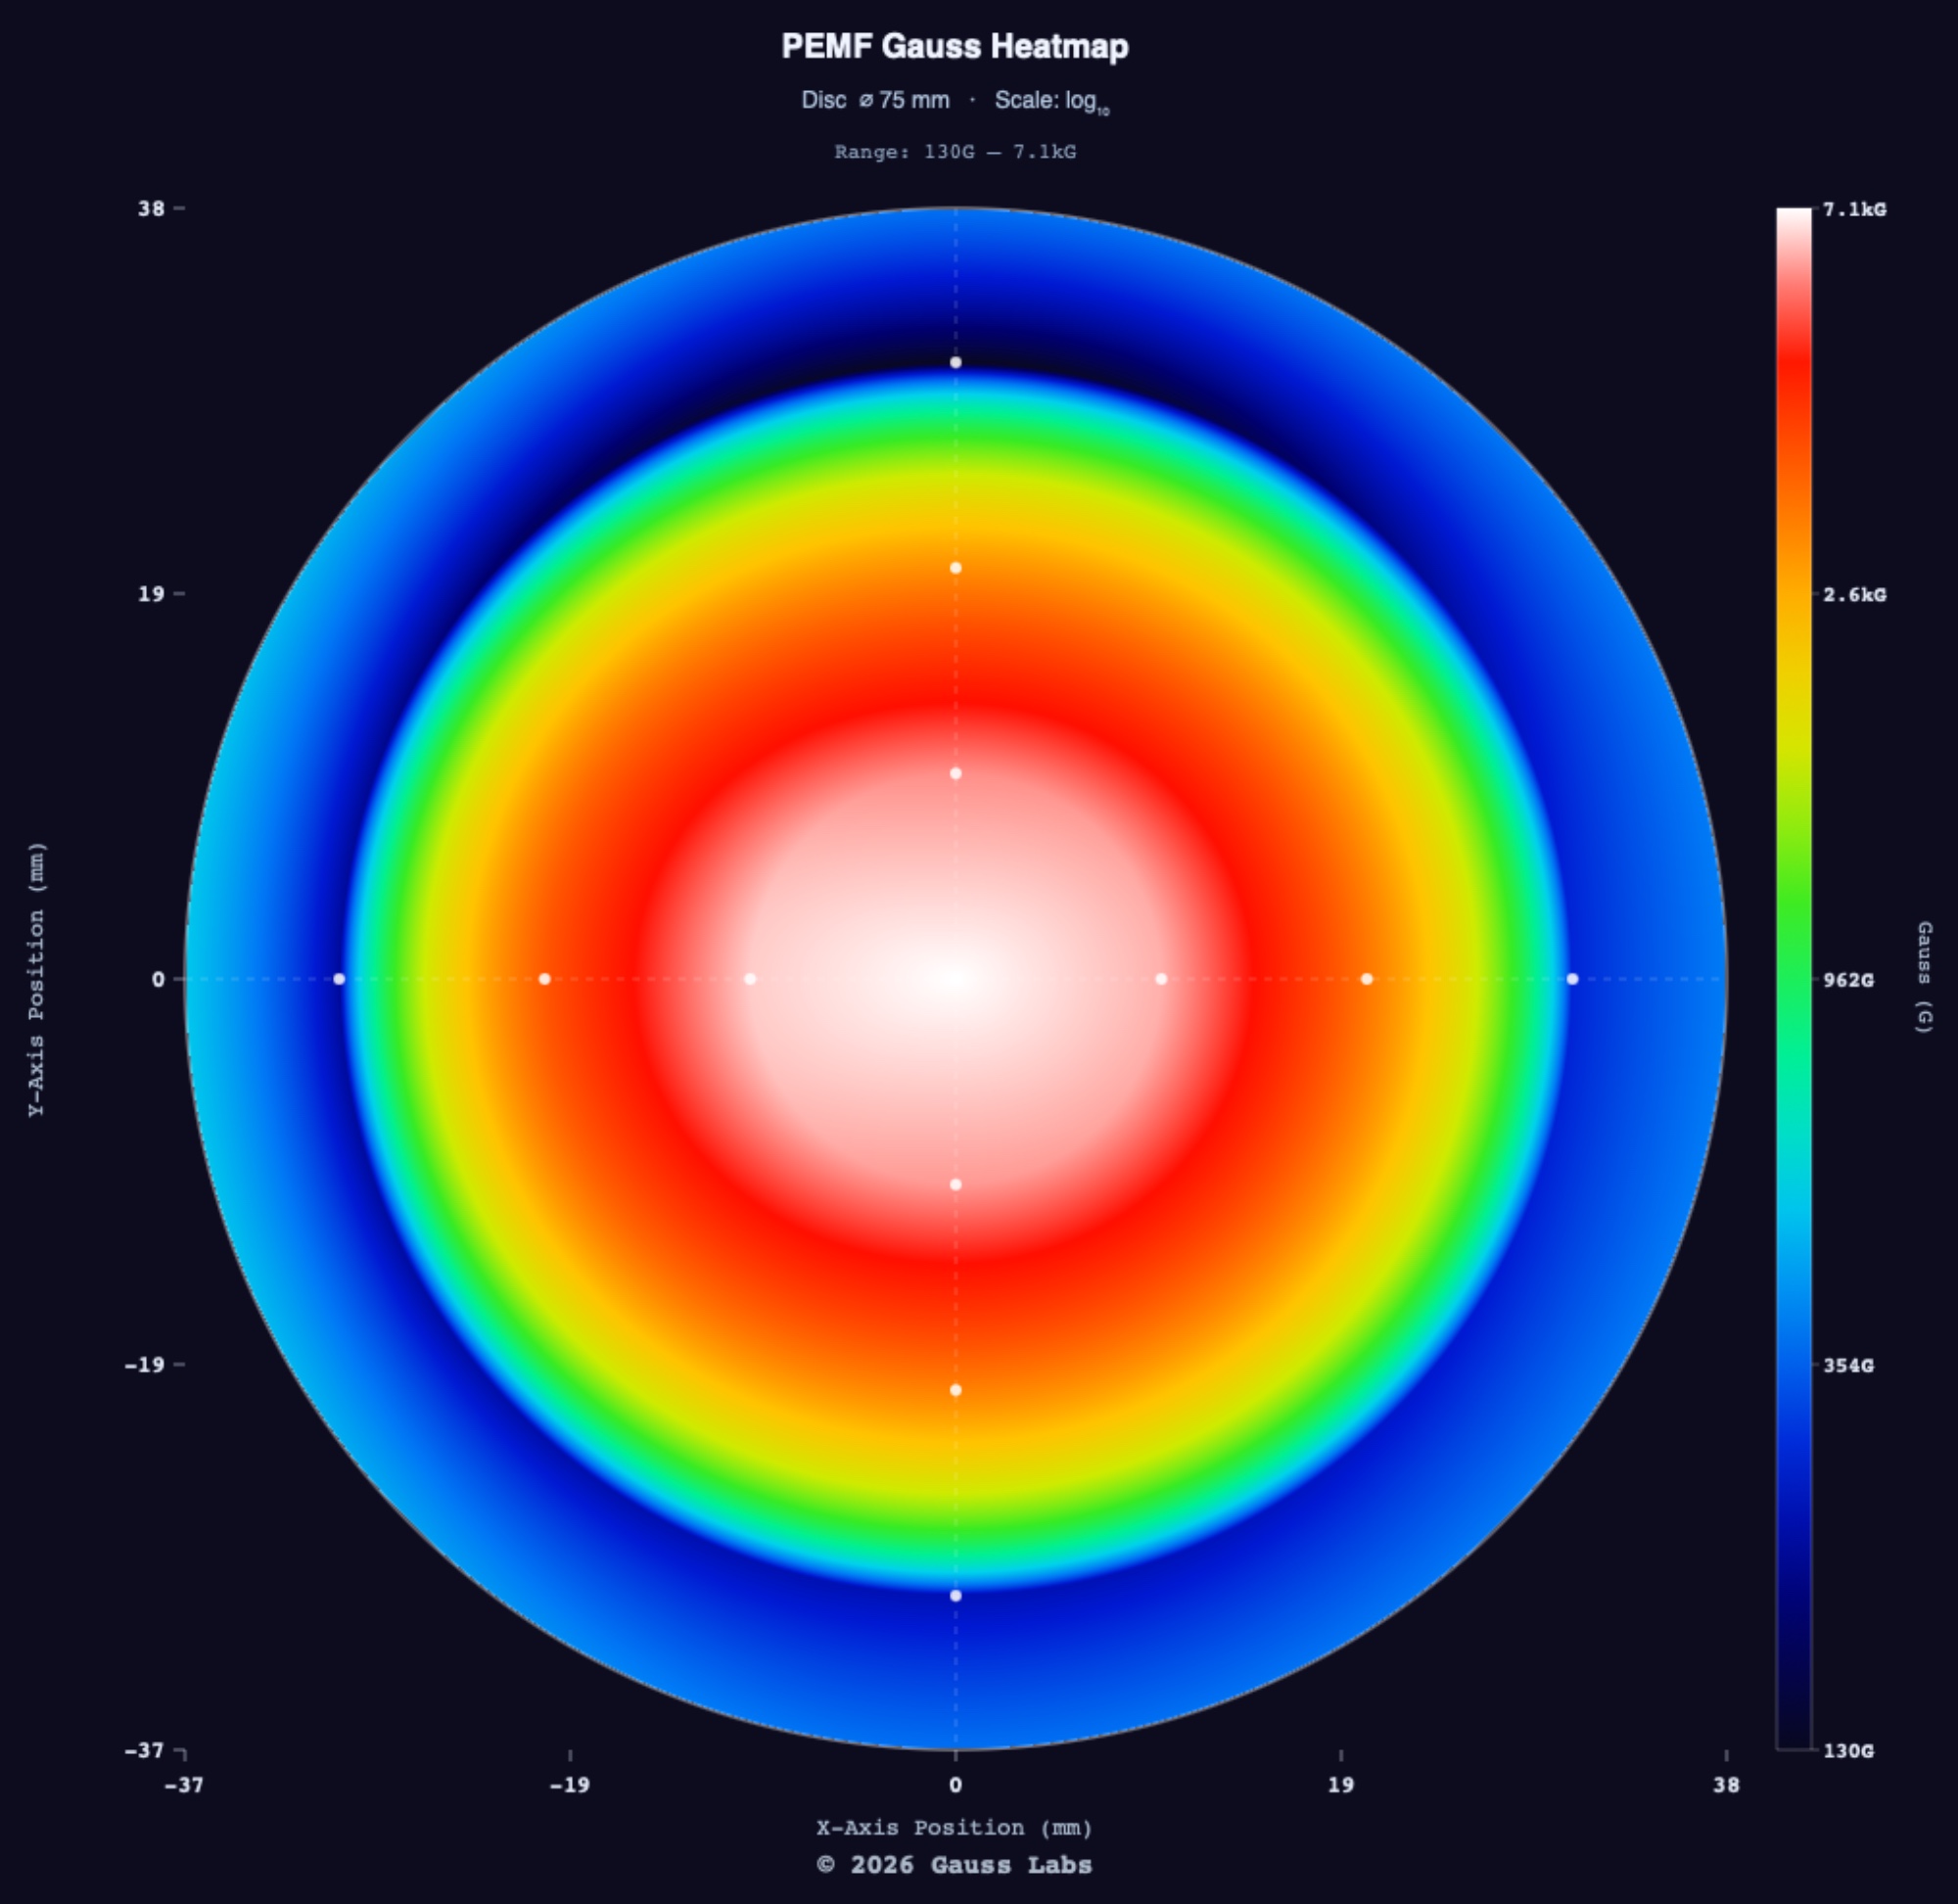
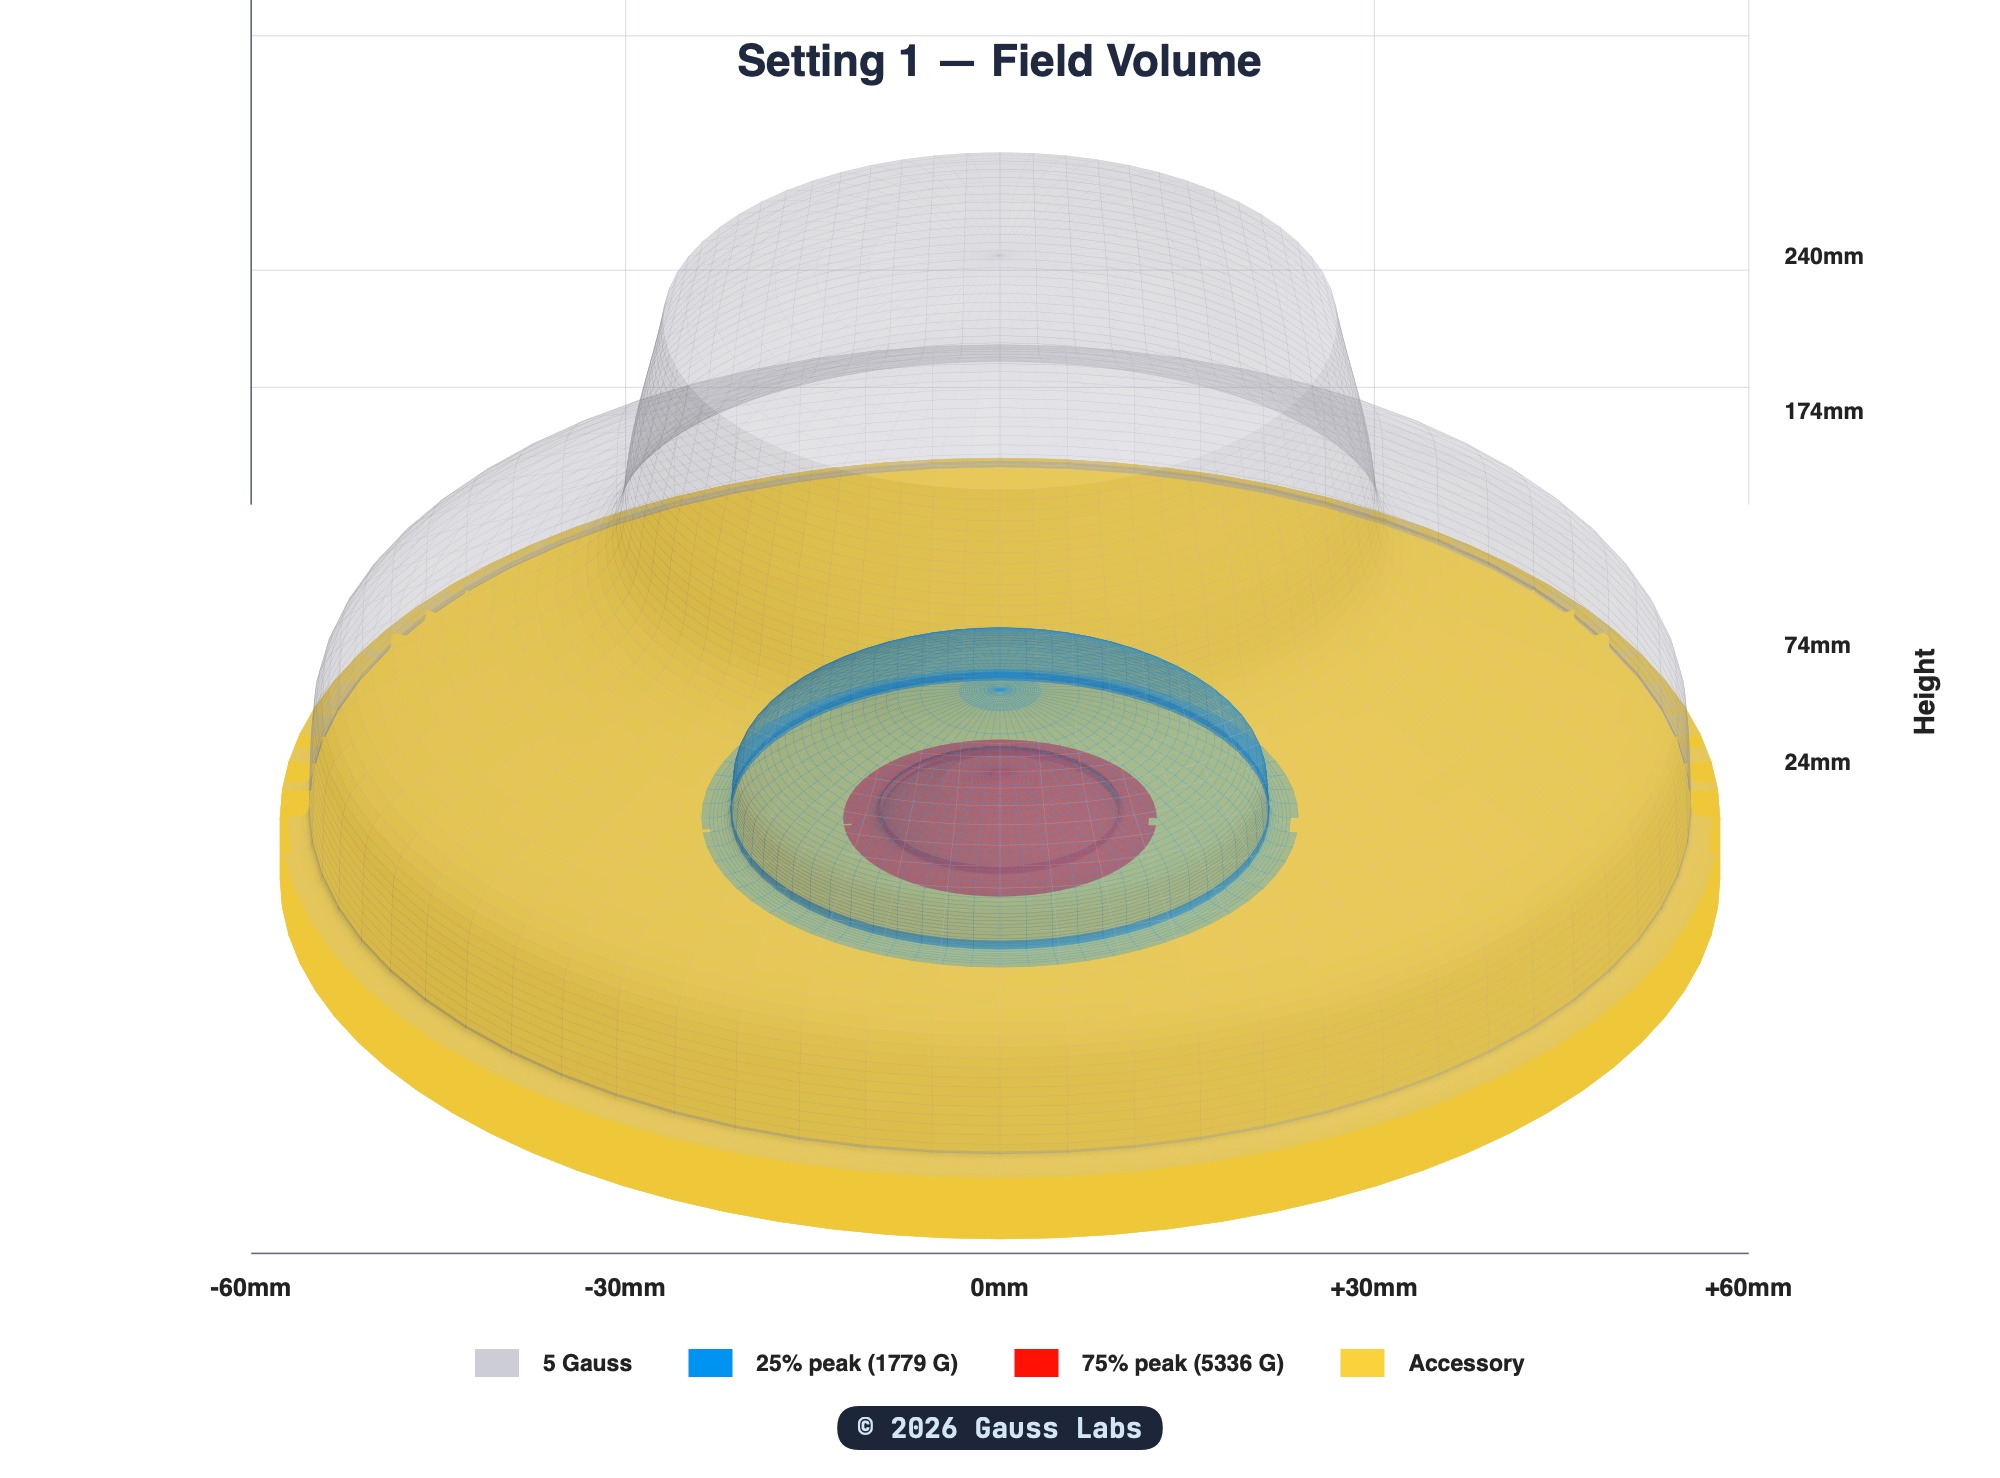
We ran a scan test on a Sota Instruments Magnetic Pulser Paddle we purchased for in-house testing. It's a 75mm (2.95 in) handheld disc accessory. The Magnetic Pulser and the Paddle now appear on the gausslabs.tech certifications registry; the data shown here comes from our own test report on the product. The scan ran across four axes at 10mm (0.4 in) point spacing, from the center out to 60mm (2.4 in), on every setting.
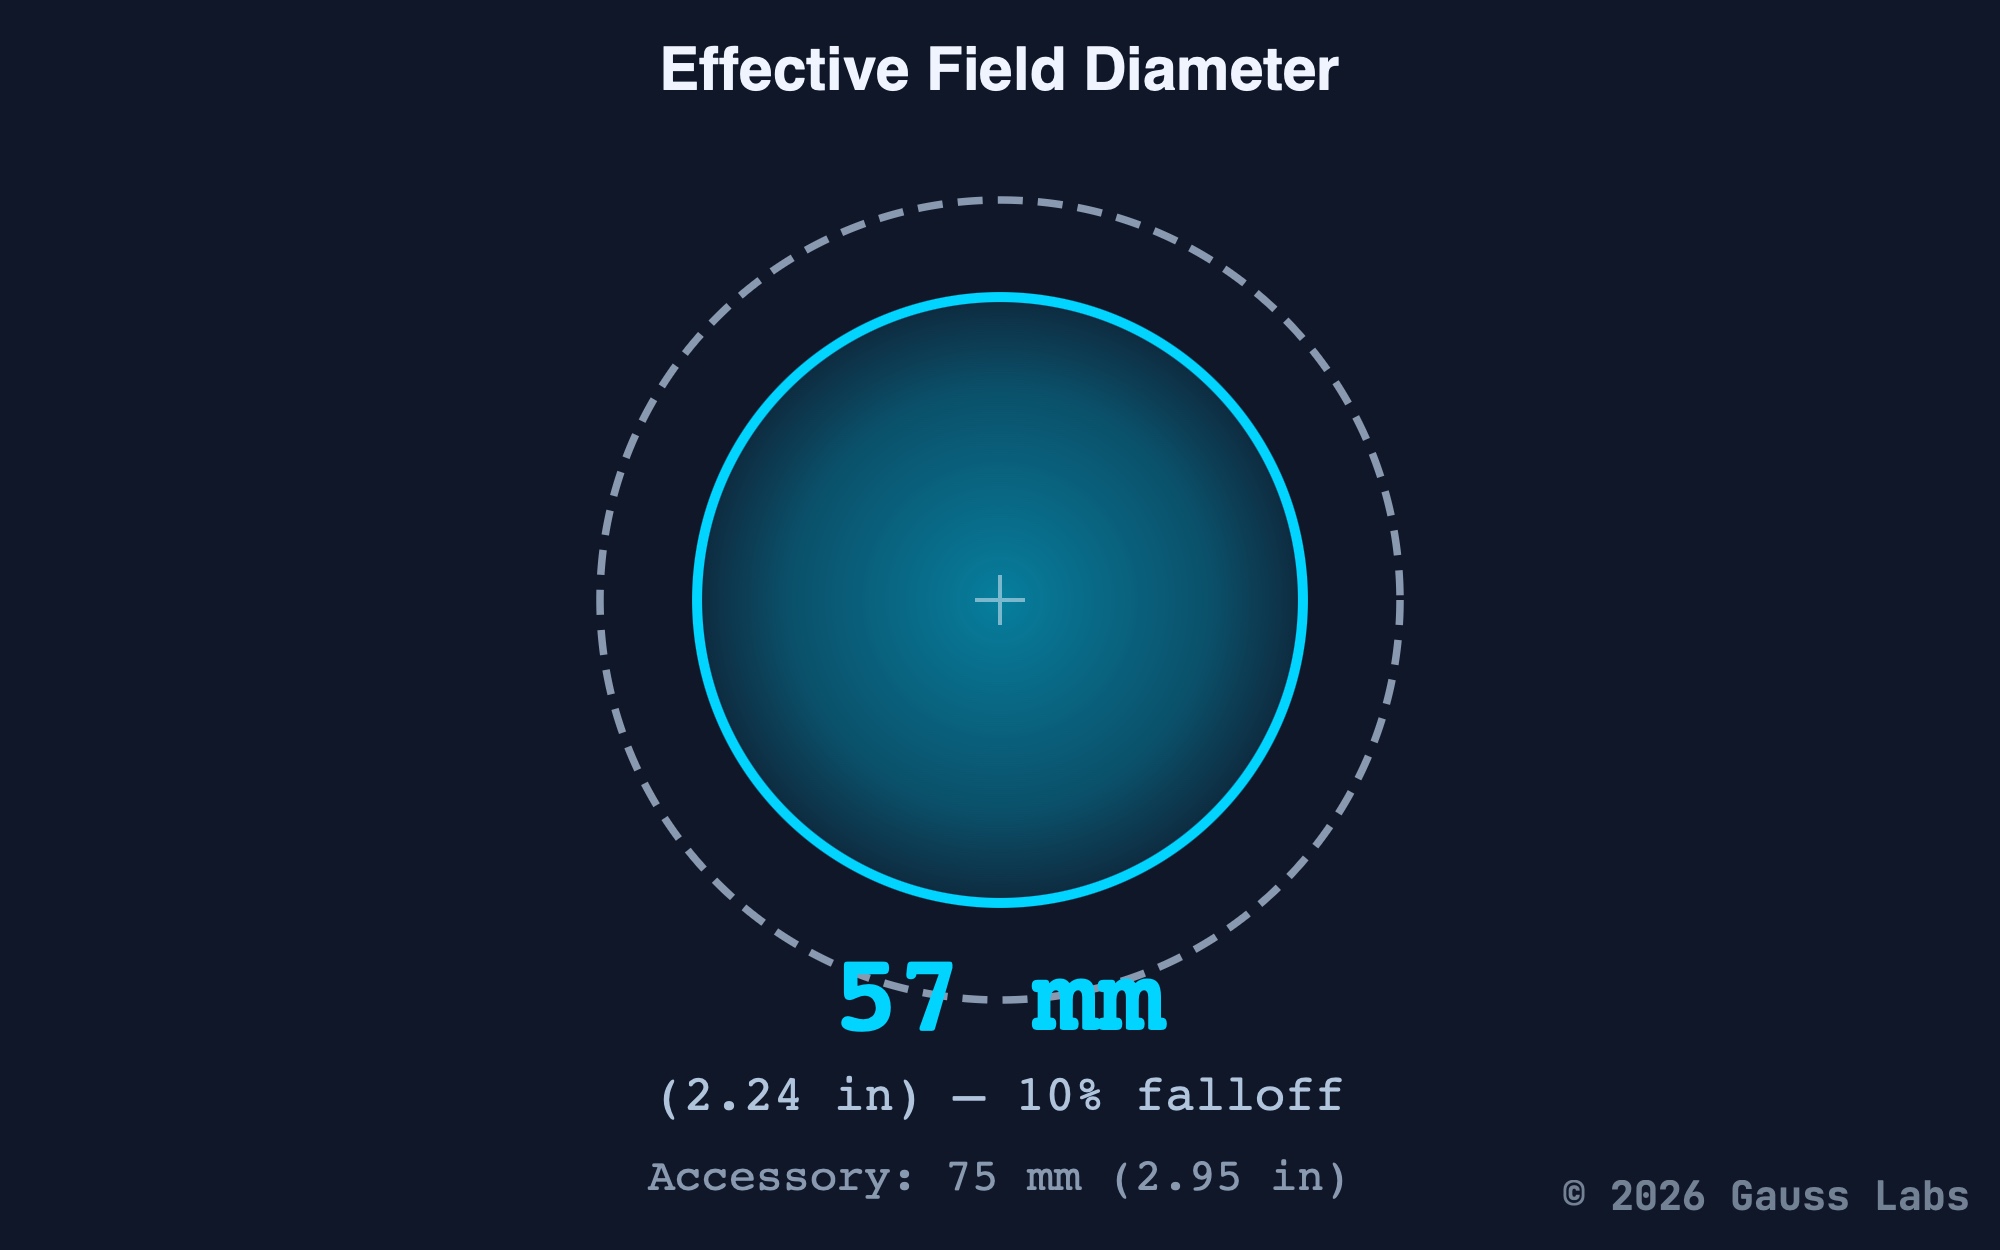
At the geometric center, the peak is 7,115 G. At 10mm (0.4 in) out, the field still holds in the 6,000 to 6,580 G range across the four scan lines. At 20mm (0.8 in) out, the four-line average is roughly 3,265 G, just under half the peak. By 30mm (1.2 in) out, it's down to the low hundreds. The 50% falloff sits at 19mm (0.75 in) from the center. The effective field diameter, the width where the field is still strong enough to matter, is 56.8mm (2.24 in). A spec sheet that printed only "7,115 G" would be accurate, but tell your buyer nothing about how the accessory performs.
Slew rate is arguably the most important metric to publish.
Some manufacturers respond to the single-number problem by publishing nothing at all. They're right that one value alone is misleading, but a blank spec sheet leaves the buyer with nothing to compare and nothing to verify. The vacuum gets filled with whatever else is in the brochure: a stylized field-line illustration, a hero claim, a glossy photo of a treatment session. None of those carry the buying decision either.
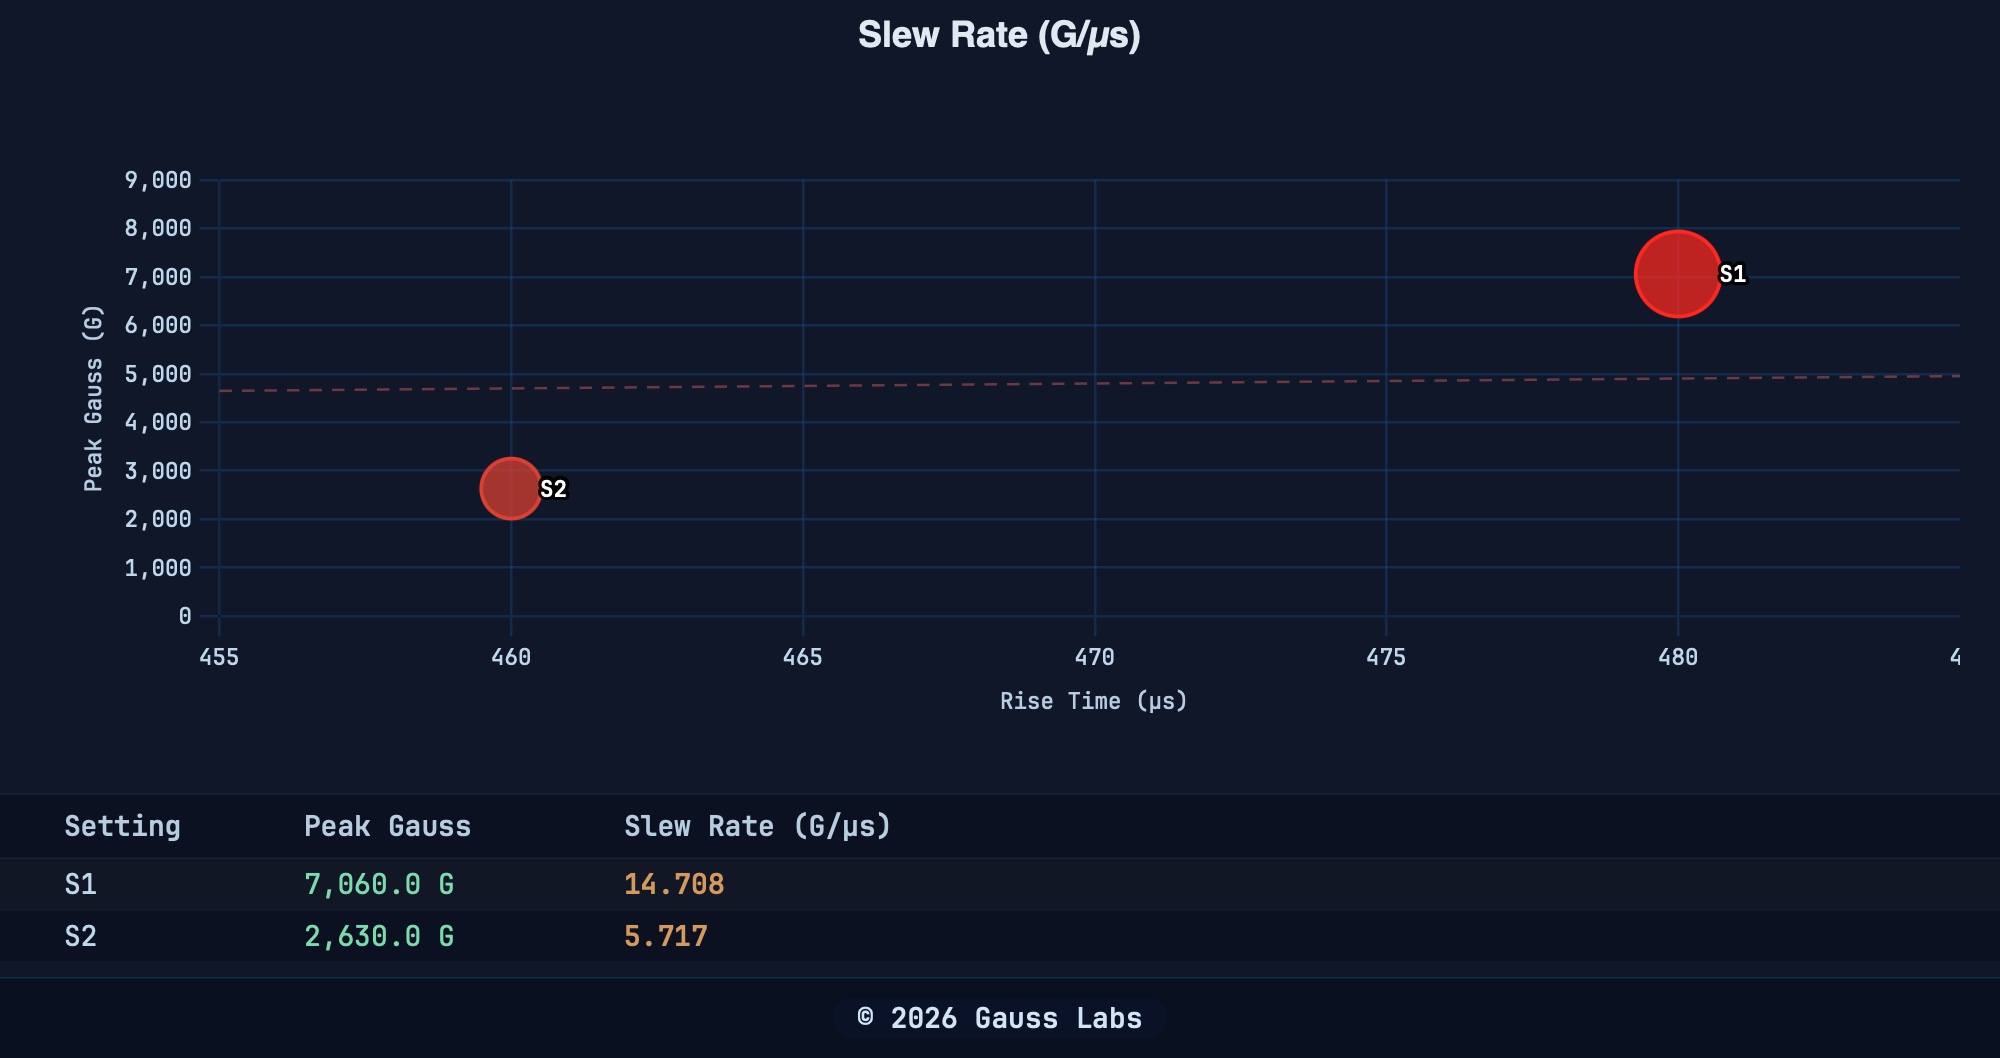
Of the metrics that belong alongside the peak, one is arguably the most important. Slew rate, the speed at which the field rises during each pulse, is what tissue actually responds to. By Faraday's law, the induced current in tissue is proportional to the rate of change of the field, not its peak value. A high peak that rises slowly induces less current than a moderate peak that rises sharply. Almost no spec sheet prints slew rate.
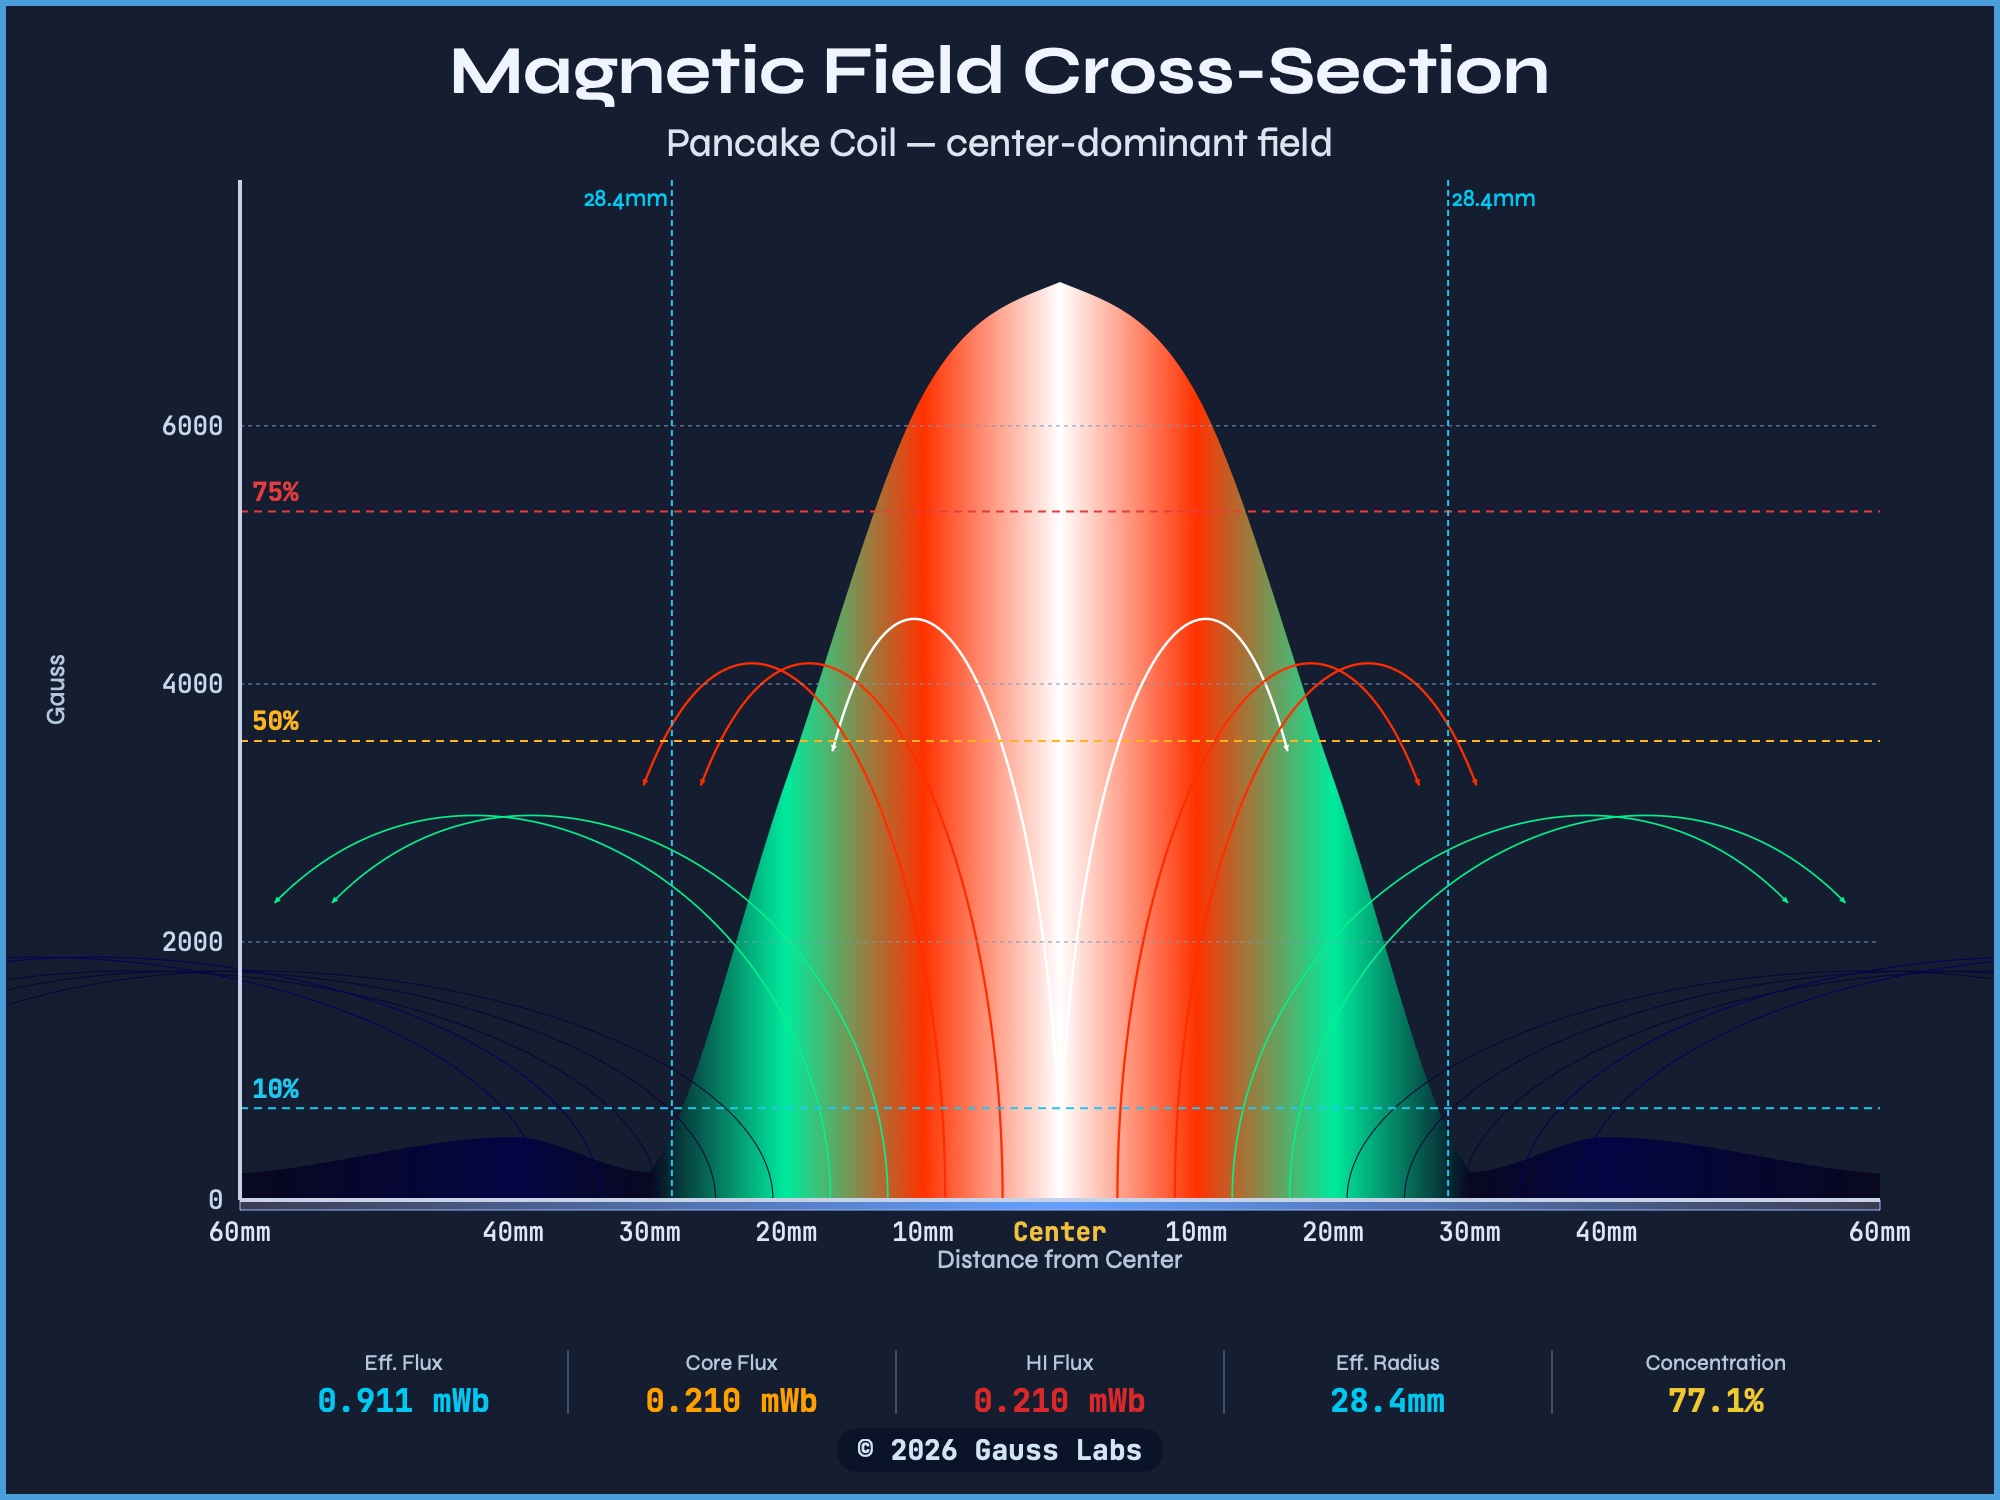
Four measurements belong alongside the peak.
Here's how each looks in a Gauss Labs report for the Sota Instruments Magnetic Pulser Paddle, starting with slew rate.
Our full report shows what the spec sheet can't.
Our public example reports show these four measurements (and many more) for one device tested across nine power settings, paired with two accessories. The accessories share a housing class but use different coil constructions inside. They produce different peak values, different effective field diameters, and different shapes on the heatmap. By peak value alone, one accessory looks roughly two and a half times stronger than the other. The full measurement set tells your buyer something different: which one belongs over a small joint, which one belongs over a broader area, and what each delivers at the surface.
Each value in our example reports is tied to a documented measurement, every chart is generated from the same test data, and every page of methodology is published alongside the result. You can pull the charts and measurements that matter most for your buyer's use case. Your sales conversation shifts: from defending a single peak value to handing them what they need to decide.
Talk to us about what to publish alongside peak Gauss.
Your peak Gauss value is accurate. The four measurements around it are the bigger picture your buyer needs. If you'd like to talk through which ones your buyers are starting to ask for, we'll take the call.
Schedule a Call See Example Reports