
Two honest pictures of the same PEMF mat scan can look very different.
If a seller shows you a colorful map of a mat's field, most of what you're looking at was drawn in between a fairly small set of readings. Whoever draws it decides how to fill the space between those readings and where to set the top of the color scale, and the caption seldom says which. Our 3D field viewer now lets you change both on the same data and watch the picture move.
A mat is scanned along lines, and the picture fills in the rest.
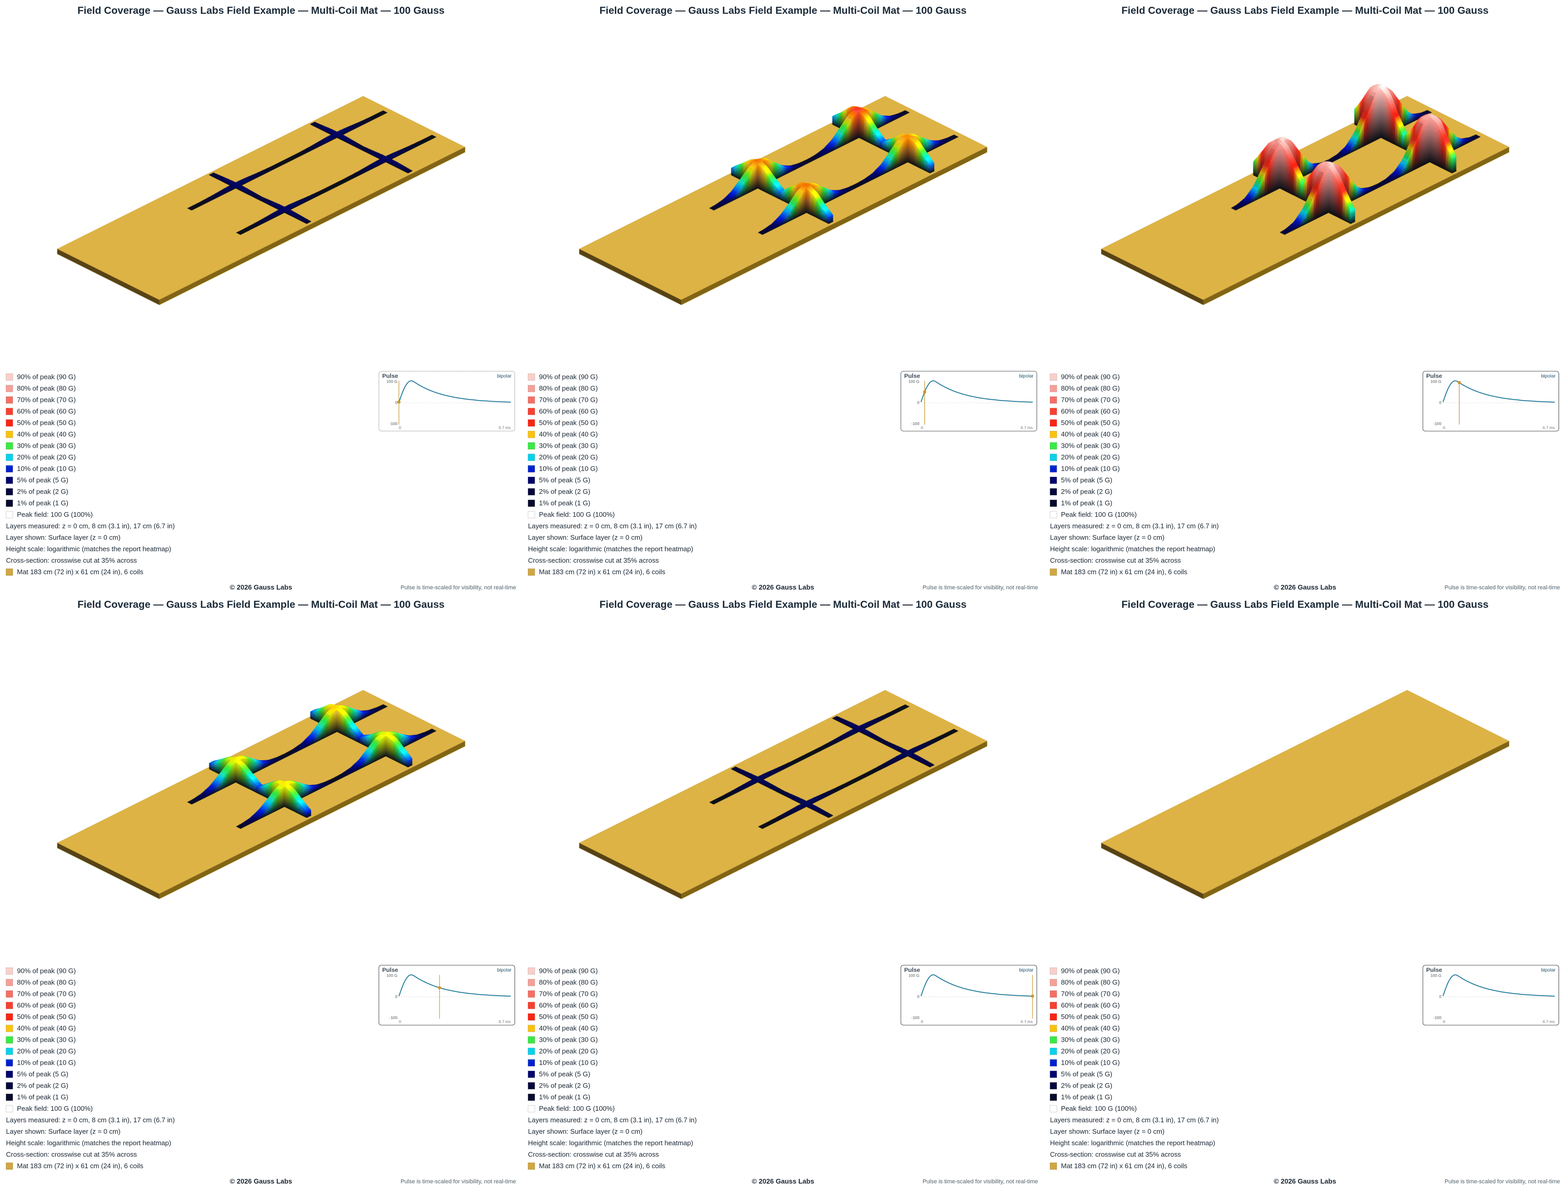
A probe reads the field at one point, so a scan is a set of points. On a pad the size of a mat, those points run along a few scan lines rather than covering every square centimeter. Everything between the lines has to come from the picture, because nobody measured it.
You can see how much that leaves out on the mat example in our 3D field viewer, which can draw only the lines a scan follows and leave the rest of the pad bare. That example is a six-coil pad, 183 by 61 cm (72 by 24 in), and its values are modeled from its coil layout rather than probed, placed where a real mat scan would put its points, 50 mm (2 in) apart. The loop, pancake and donut examples beside it are real Gauss Labs measurements, and each page says which kind it is.
The first choice is how the gaps get filled.
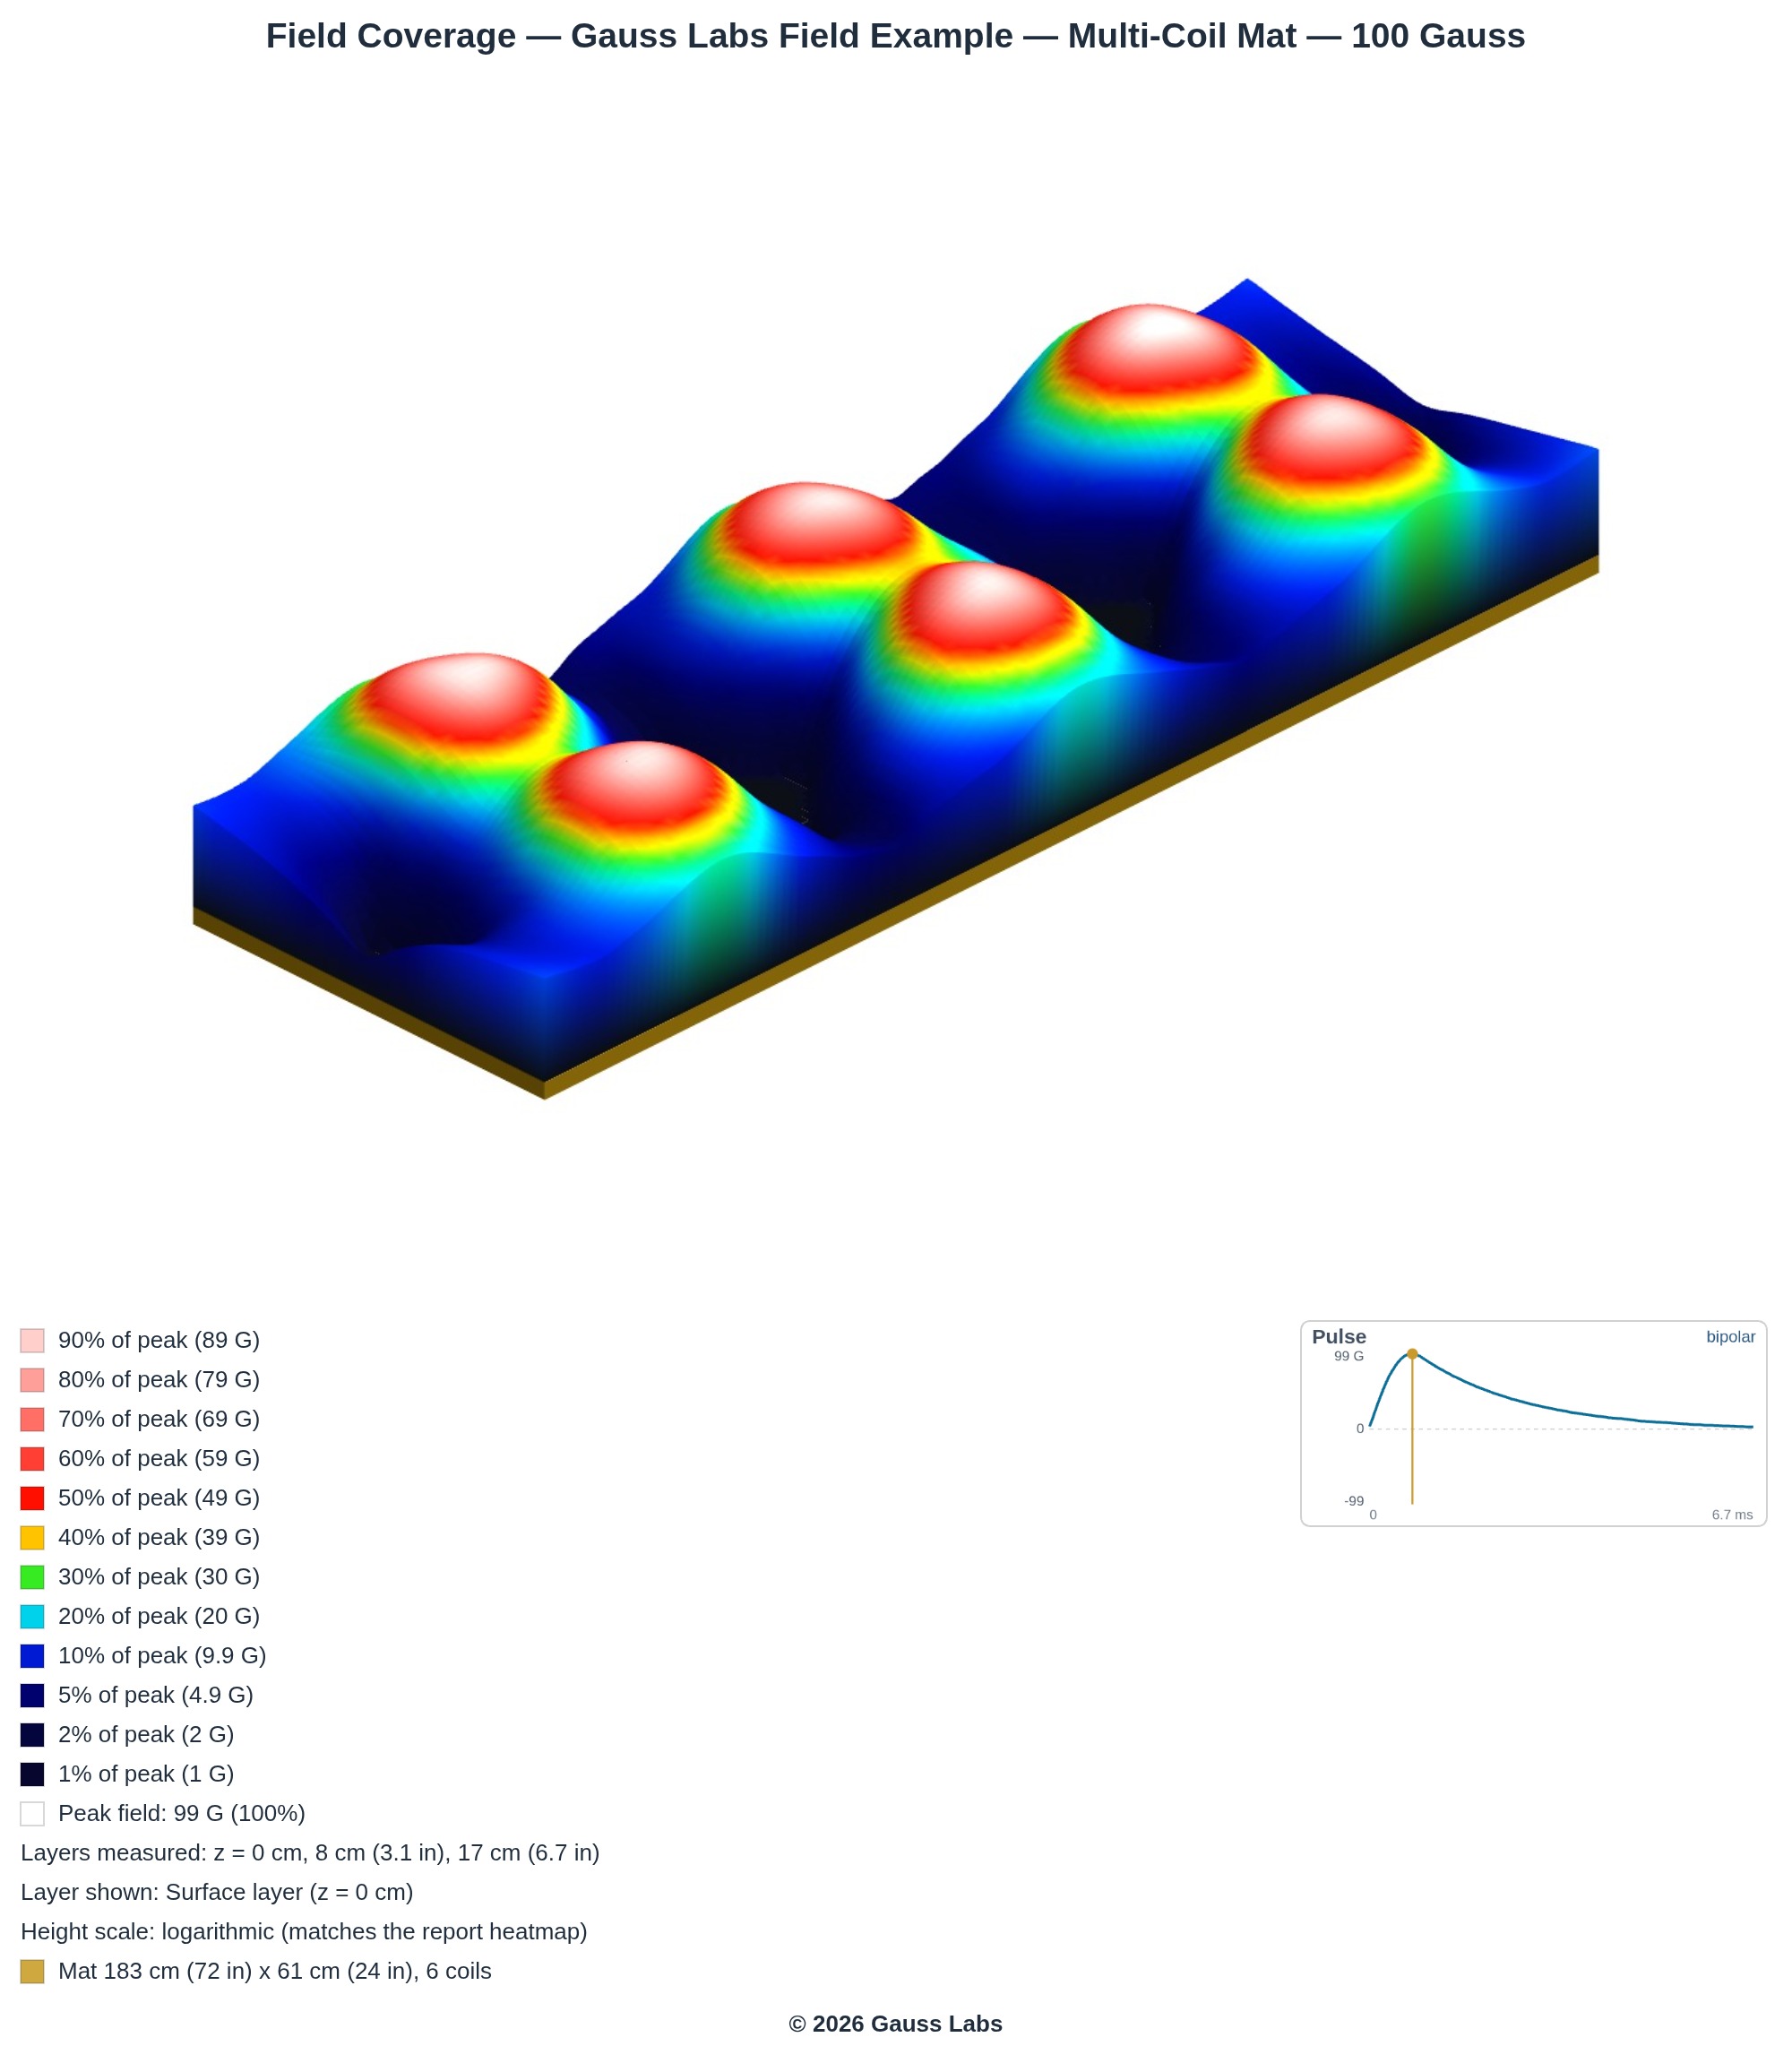
There's more than one reasonable way to fill the space between scan lines, and the viewer offers a choice of them on the same data. The default, coil reconstruction, rebuilds each coil from its nearest scan lines and draws it round, centered where the coil sits in the mat, and it's also what the report heatmap shows. A fitted field fits one surface to every point at once, so a coil can be drawn out of round where the readings point that way. A variant of it keeps each coil round, the shape the manufacturer lists. A measured point blend spreads the readings by distance with no coil model at all, which makes it the most literal option, though on a coarsely scanned mat it flattens into a broad gradient.
Every option works from the same points, and none of them adds a reading. Each is a fair way to draw the field as long as the picture says which one it used, which is the case we made for any field map in our post on the four-axis scan. On a multi-coil mat the choice shows more than it does on a single disc, since the coils sit apart and the fill sets what the space between them looks like.
The second choice is where the color scale tops out.
A field picture colors each value as a share of a peak, so the legend reads 90 percent of peak, 50 percent, 10 percent and on down. The choice of peak matters, because a reconstruction normally scales to its own highest point, and that can land above or below the highest value any scan point actually read.
On the mat example, the renderings top out at three different values. The default coil reconstruction peaks at 100 Gauss (10 mT), the fitted field at 99 Gauss (9.9 mT), and the highest value at any scan point is 95 Gauss (9.5 mT). The viewer's measured range option sets the color scale by the values at the scan points, from the lowest to that highest one, and draws the gaps with the measured point blend.
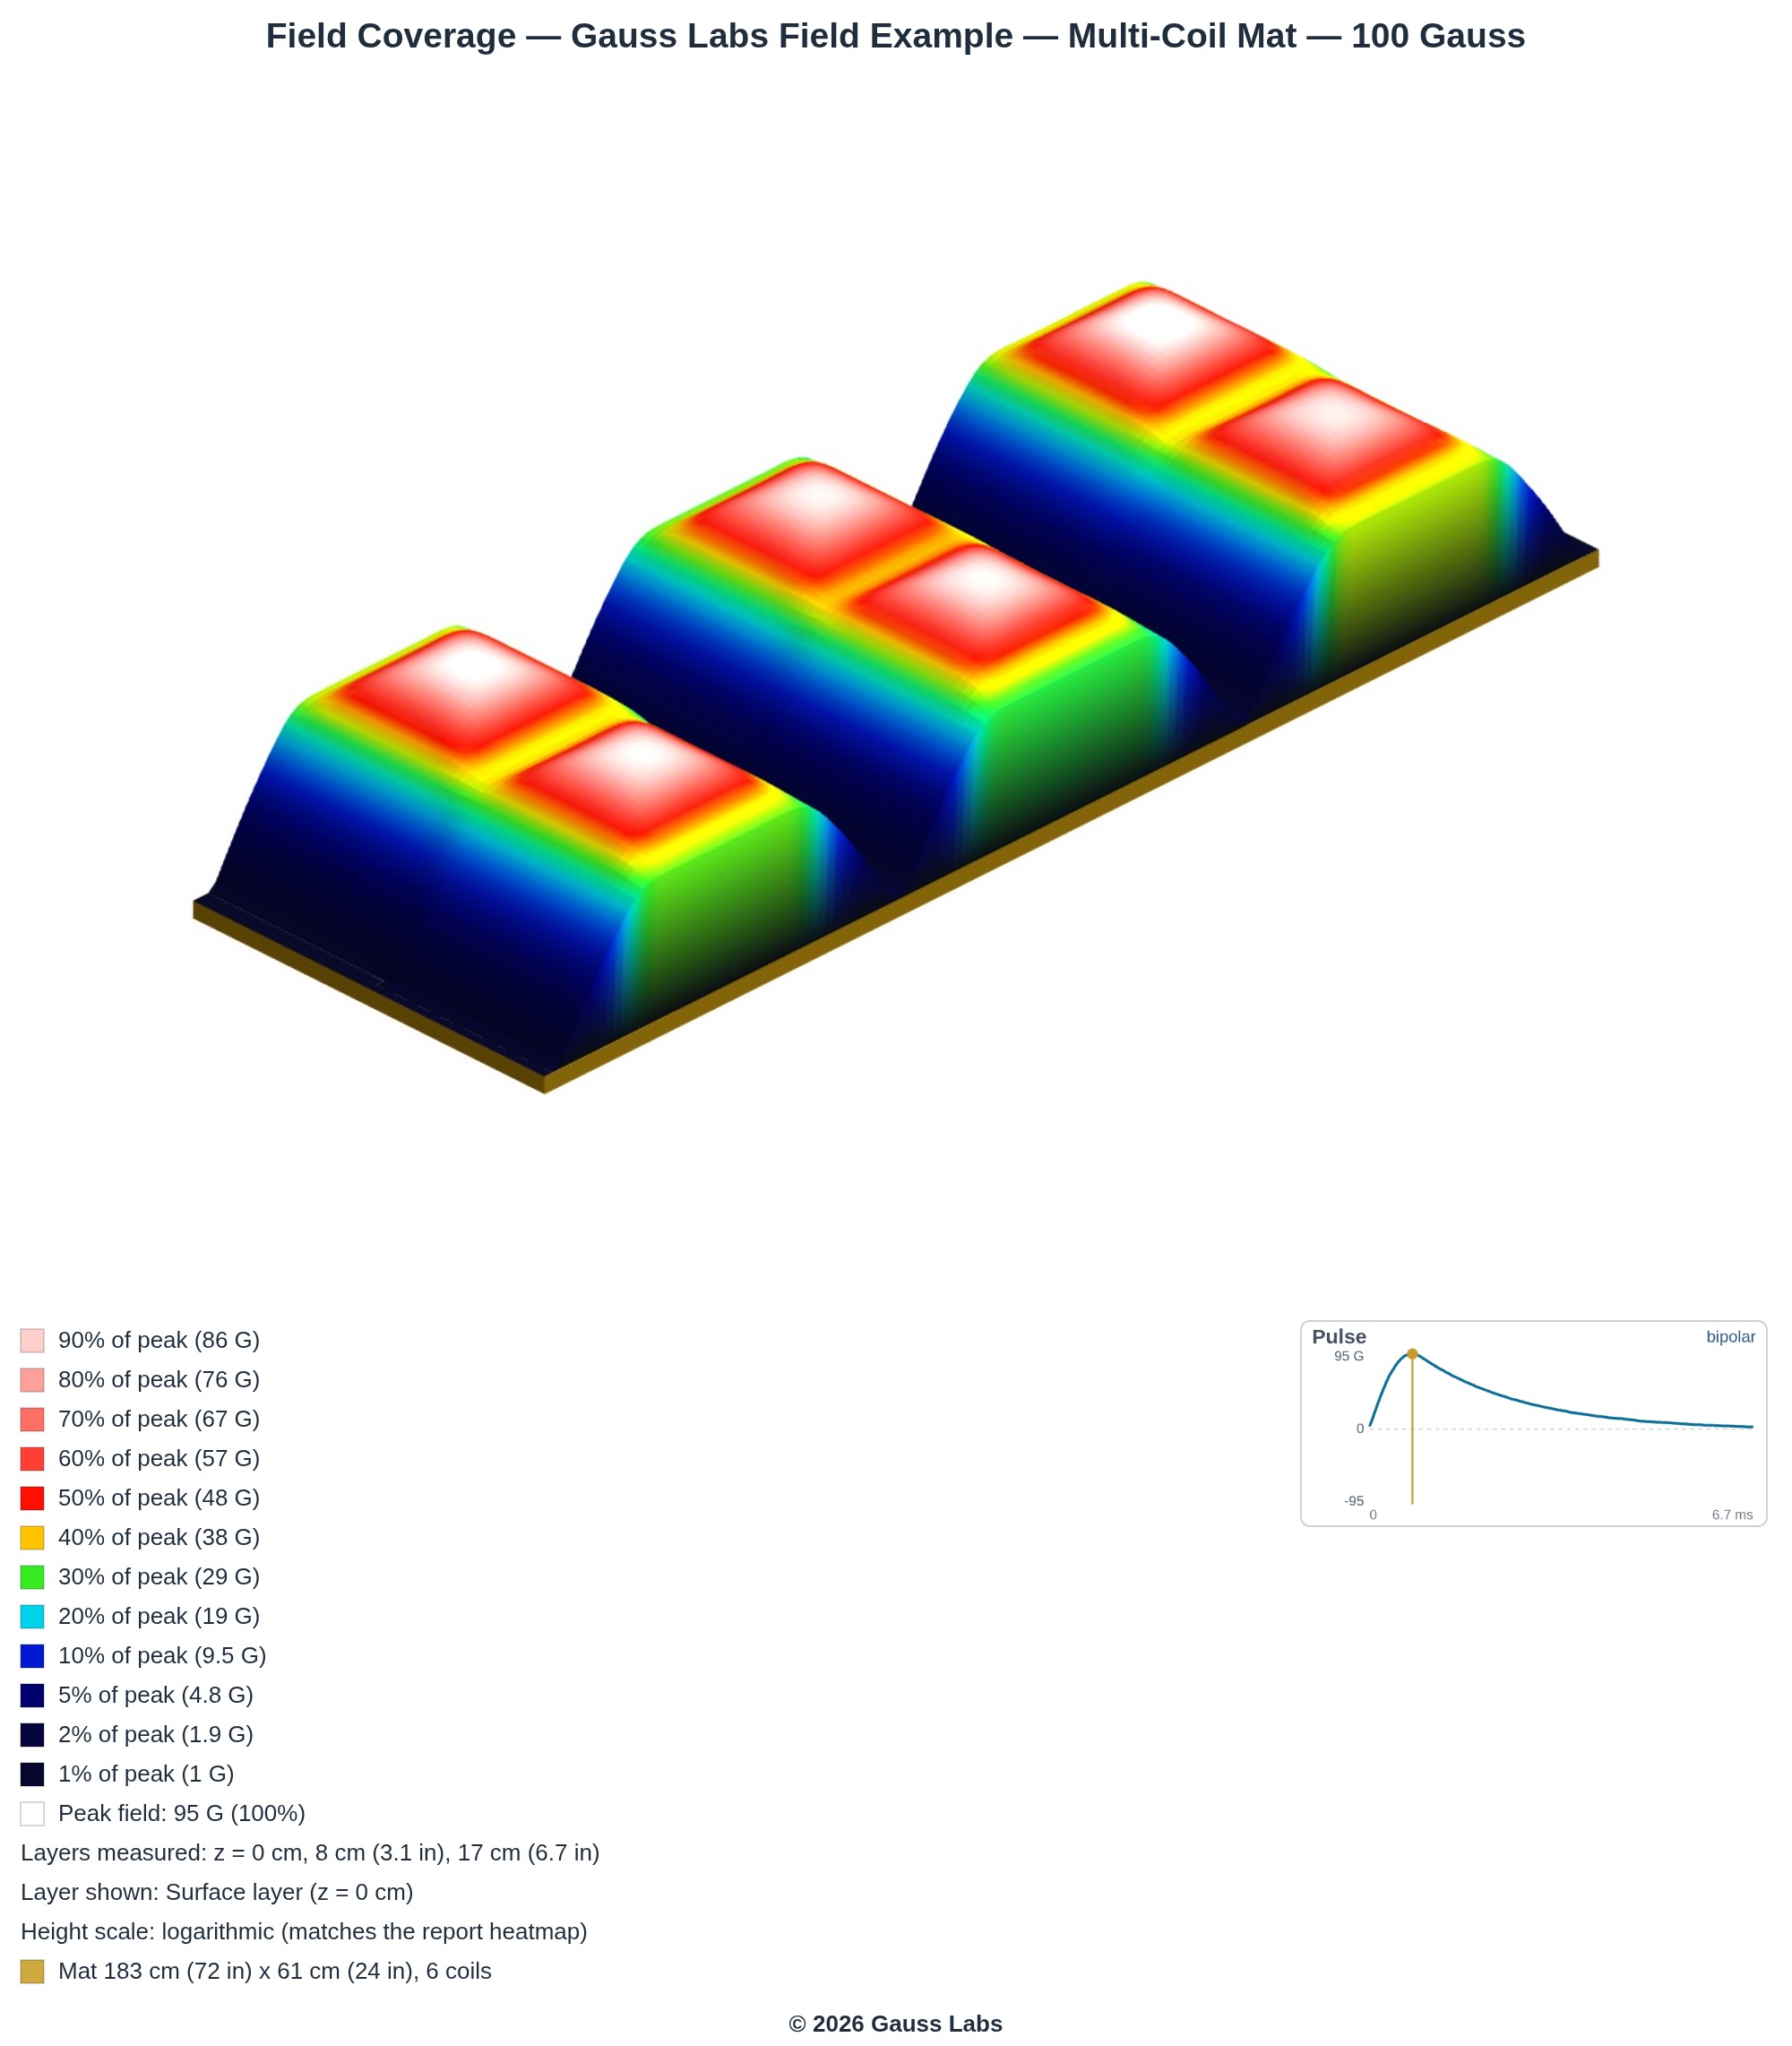
Part of that difference comes from the fill and part from the scale, and the scale does more of it than you might think, because the color bands are spaced by ratio rather than in equal steps (the ramp is logarithmic). Moving the top of the scale by a few Gauss doesn't only recolor the peaks. It shifts every band on the mat, so the same field reads warmer or cooler everywhere at once.
So which picture is the honest one? Both are, for different questions. The coil reconstruction matches how a mat is built, while the measured range uses only the values at the scan points. On a real mat, those are values a probe read. A third option, measured range smoothed, widens the blend so the picture reads calmer between scan points, and it gives up a few percent of the peak to do it. That's a fair trade to make as long as it's stated.
You'll meet the same issue in our measured point viewer, where each height above the pad is colored against its own strongest reading, so a layer well away from the surface can look as vivid as the surface while reading far less. We walked through those heights in this week's post on checking a sealed mat, and the advice there holds here too: compare the values, not the colors.
Ask how a picture was made before you compare two mats.
A field picture in a brochure is usually one still with a legend you can't change, and that's fine once you know what went into it. It's the same habit as checking what a certification actually covers before you trust the badge.
Three questions for any picture of a mat's field.
- "Was this measured or modeled?" A modeled field shows what a mat of that layout should do, and a measured one shows what a single unit did, so the two answer different questions.
- "How was the space between the readings filled?" Ask for the reconstruction by name, and for how far apart the scan points were.
- "What is the top of the color scale?" A scale set to the picture's own peak rather than the highest reading can make the whole mat look warmer or cooler than the readings behind it.
Want your mat's field pictured with every choice named?
We scan a mat along its rows and columns at every height we measure, and our 3D viewer names the reconstruction behind each picture. If you'd like to see the measurement work first, our example reports are open to read.
Schedule a Call See Example ReportsTwo pictures of one mat can look very different and both be fair. Before you compare mats by their colors, ask how the gaps were filled and what sets the top of the scale.