
Read a PEMF spec sheet line by line: some numbers help, some need more context, and some are missing.
You're holding a PEMF spec sheet and trying to work out which of its numbers you can use to compare devices. We'll go through an example sheet and sort each line into three groups: numbers that help once their conditions are stated, setup context such as a frequency range or a program name, and numbers the sheet leaves out. Then we'll show what the missing lines look like on a real report, using a paddle we measured. If any of the terms are new, our glossary of twenty terms puts each one in plain words.

A peak figure helps only with its setting and distance.
The first line most sheets print is an intensity, written something like “up to 5,000 Gauss,” where Gauss is the unit we use for magnetic field strength. That's the peak field strength, the highest the field gets at one spot. The words “up to” usually mean the strongest setting, so the figure describes one setting and nothing about the rest of the dial. It also depends on the accessory fitted and on how far from the surface the reading was taken, since a field weakens quickly with standoff distance. With the setting, accessory and distance stated, it's a number you can check. Without them you can't set it beside another sheet's number.
Check the unit as well, because 1 Tesla equals 10,000 Gauss and a sheet that says 0.5 T is giving the same strength as one that says 5,000 G. A battery or wall adapter on the sheet describes runtime and not the peak, as our post on batteries explains.
A frequency range shows what the hardware could reach.
The next line reads something like “1 to 100 Hz.” Frequency is how many pulses a device delivers each second, in hertz (Hz), and it's independent of field strength, so a high pulse rate can come with a low Gauss figure and the reverse. A range gives the extremes the hardware could reach, while the settings you can actually select may be a handful that never touch either end. Frequency and waveform also matter to cell-level research, which sits outside the electronics measurements we make, so here we ask only what a line tells you about the hardware.
We can show how that looks on a measured unit. Our in-house tester, the Magnetic Pulser Paddle, has two settings. They pulse at 0.302 Hz and at 1.09 Hz, so a single range on a sheet would hide that there are two ways to run it. The useful line is a frequency for each setting you can select.
A program name or a waveform label isn't a measurement.
A program called “Relax” or “Recovery” tells you what a maker calls it and nothing about what the device does in it, since the name doesn't give the frequency, the strength or the waveform. Ask for those three for each program, because without them two programs from two makers can't be compared. A waveform label has the same problem when it says “advanced pulsed,” which isn't a shape. The shapes are sine, square, triangle and sawtooth, and the waveform type is what to ask for.
A coil count doesn't say how evenly the field spreads.
“Coils: 8” tells you how many coils are inside a mat. It doesn't tell you how evenly they spread the field across the surface you're lying on, and that is a separate measurement. For a multi-coil mat we read it as coverage uniformity, the consistency of the peak from one coil to the next. Our post on what a mat's coil count leaves out goes through it.
A measured report shows what the missing lines look like.
On the Paddle we measured both settings and read the lines a sheet usually leaves out. Setting 1 peaks at 7,120 Gauss and setting 2 at 2,630 Gauss, and the rise time is 480 microseconds on setting 1 and 460 on setting 2.
The effective field diameter, the width across which the field stays at least a tenth of its peak, is 56.4 mm (2.2 in), and the field symmetry is 95.9%. A sheet could print any of these if the maker had measured them, and a reader could then check them against another device.
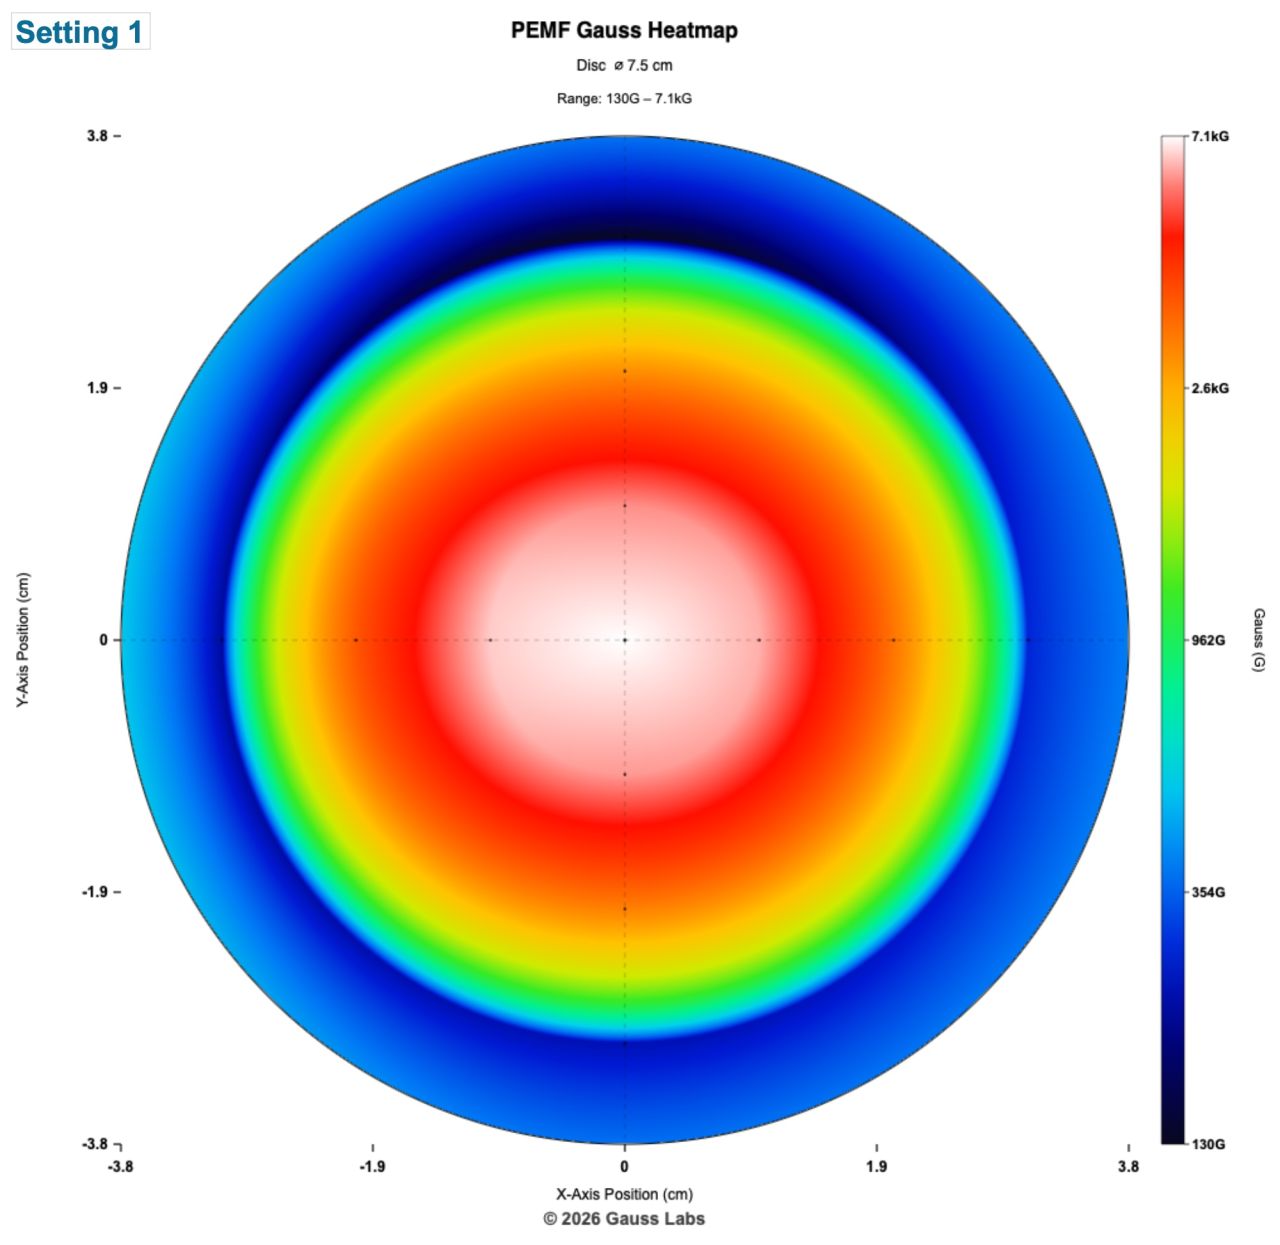
The heatmap is what a coil count can't give. It shows where across the surface the field is strongest and how it fades. We describe how we read it in our post on the four-axis scan.
Four lines to ask for on any sheet.
- “What's the peak at each setting, and how far from the surface was it read?” One figure with no setting or distance is a number you can't compare.
- “How fast does the pulse rise at each setting?” Two pulses can share a peak and climb at different speeds, so ask for the rise time and for how it was read.
- “How does the field spread across the surface?” An effective field diameter or a field map answers this, and for a mat it takes a map of the whole surface.
- “Who measured it, with which accessory?” A maker's own figure and an independent one are different kinds of evidence, and a figure belongs to one device and accessory together.
Want these lines measured on your device?
We measure each device with each accessory at every setting, and report the peak, the rise time and the field across the surface together. If you'd like to see what that looks like, our example reports are open to read.
Schedule a Call See Example Reports